Comprehensive AUD/USD Analysis for September 28, 2023
In this comprehensive analysis, Ultima Markets brings you an insightful breakdown of AUD/USD for 28th September 2023.
Key Takeaways
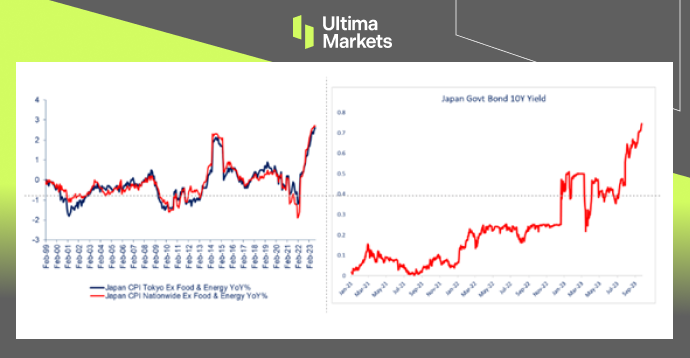
- Australian Inflation: Australian inflation reached a notable 5.2% in September 2023, in line with market expectations. This marked a significant uptick since June and is primarily attributed to the depreciation of the Australian dollar and rising oil prices.
- Market Perception: The market’s consensus was that these inflationary pressures, while substantial, would not be adequate to persuade the RBA to pursue an interest rate hike strategy. As a result, the initial reaction in the currency markets was mixed. The Australian dollar experienced a short-lived appreciation, but the prevailing sentiment soon led to a decline.
Short-Term vs. Long-Term Impact
- Short-Term Outlook: The short-term Australian data had a limited impact on the currency pair. Market attention swiftly shifted to the United States, with a specific focus on the core PCE data. Should this data continue to show an upward trend, it could maintain the possibility of interest rate hikes during the year, consequently bolstering the US dollar.
- Budgetary Concerns: However, the situation in the United States presents a significant variable. The fiscal year for 2023 is concluding, and if political parties fail to reach an agreement on the budget, the risk of a government shutdown looms large. In such an event, the market may seize the opportunity to speculate on a weakening US dollar.
Technical Analysis
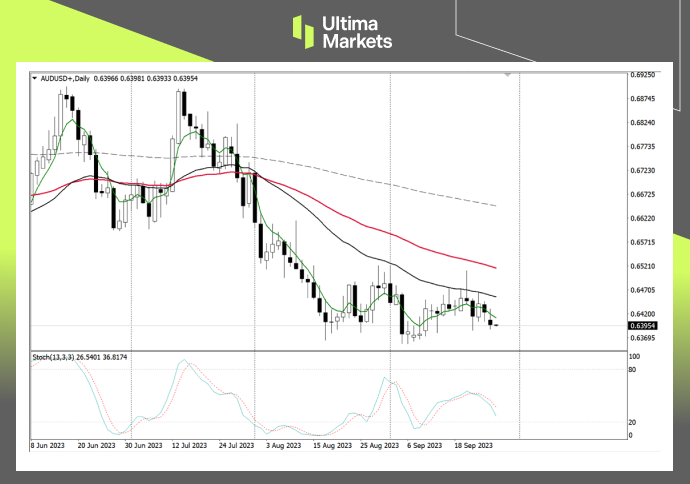
AUD/USD Daily Chart Analysis
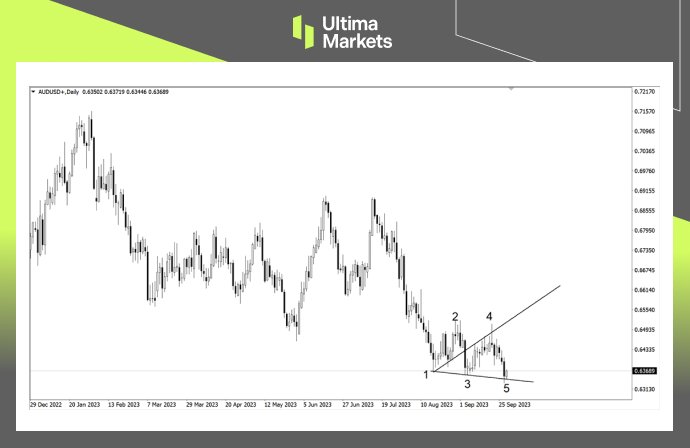
(Daily chart of AUD/USD, source: Ultima Markets MT4)
Significant Decline: The daily chart indicated an expected decline in the exchange rate following the inflation data release. Subsequently, the market exhibited a distinctive Wolfe wave pattern, which carries the potential for a substantial rebound. It’s important to note that this pattern does not signify a definitive trend reversal at this stage.
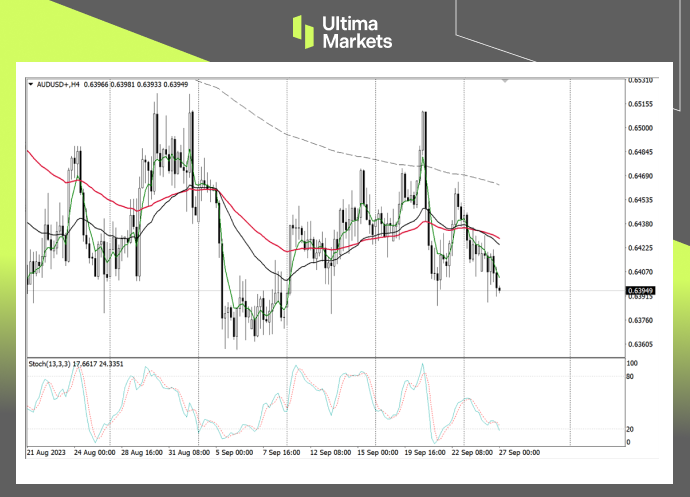
AUD/USD 4-Hour Chart Analysis
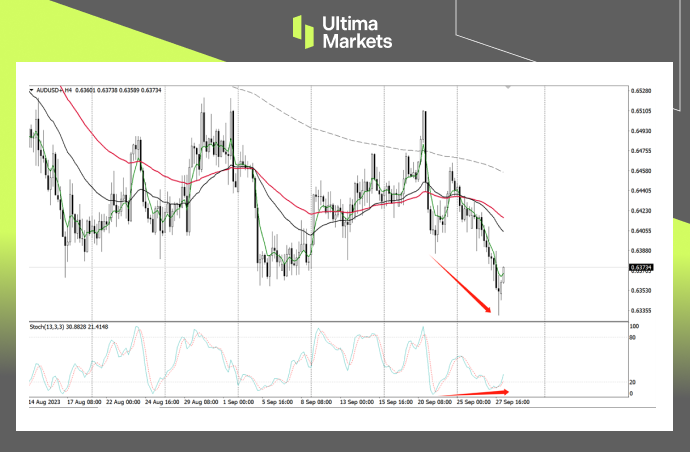
(4-hour chart of AUD/USD, source: Ultima Markets MT4)
Divergence Structure: Transitioning to the 4-hour chart, the price decline led to the formation of a stochastic divergence pattern. This suggests that sellers may find motivation to close their positions and exit at the support level. Observing the influence of the 33-period moving average is crucial.
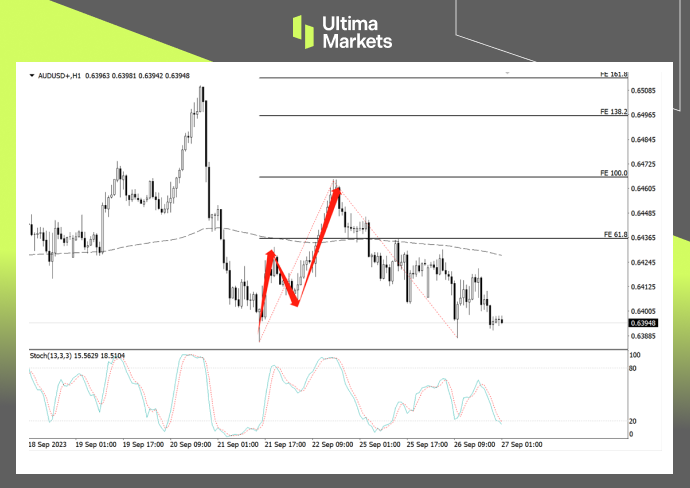
AUD/USD 1-Hour Chart Analysis
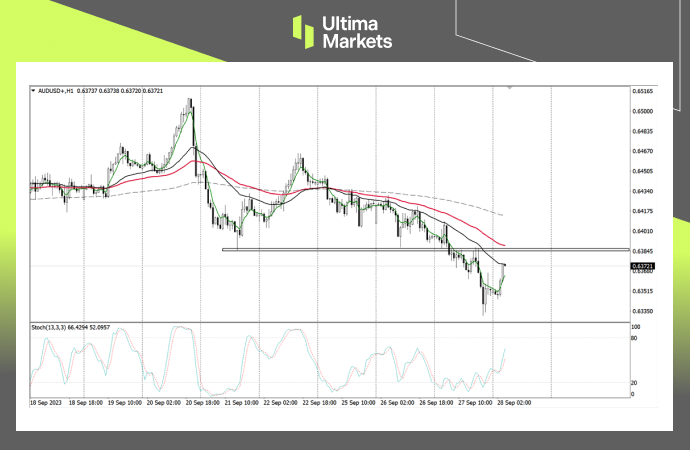
(1-hour chart of AUD/USD, source: Ultima Markets MT4)
Critical Zone: Within the 1-hour timeframe, the area around 0.63853 is a crucial support and resistance conversion zone. This level is also proximate to the 65-period moving average. A potential breakout above this resistance level may pose challenges for the Australian dollar in maintaining its downward trajectory for the day.
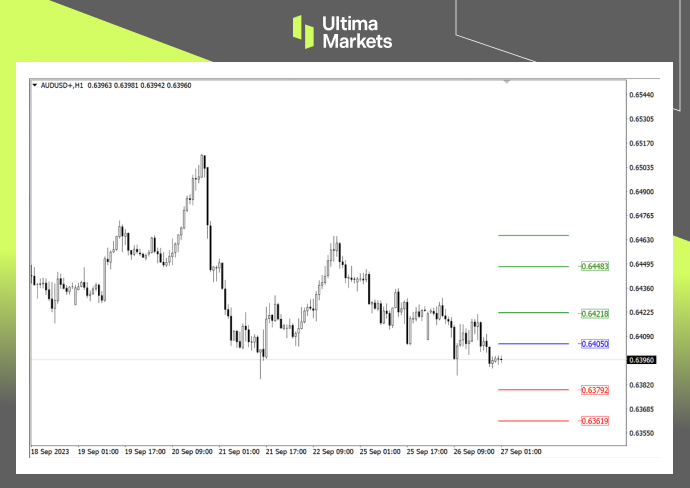
Pivot Indicator
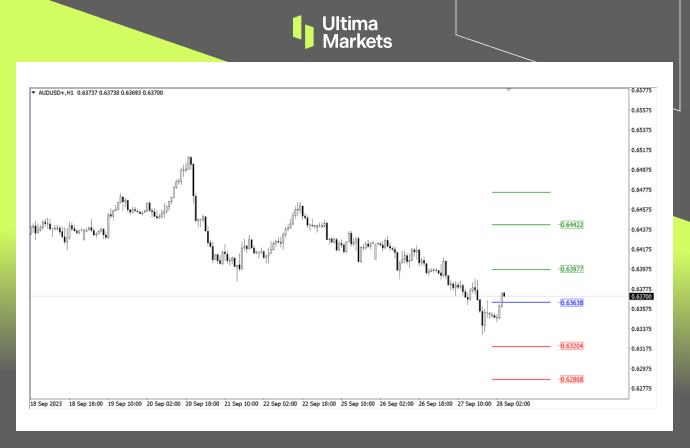
(1-hour chart of AUD/USD, source: Ultima Markets MT4)
Key Price Levels: According to the pivot indicator within Ultima Markets MT4, the central price for the day stands at 0.63638.
- In bullish scenarios above this level, the first target is 0.63977, and the second target extends to 0.64422.
- In bearish scenarios below 0.63638, the first target is 0.63204, with the second target at 0.62868.
Legal Documents
Ultima Markets, a trading name of Ultima Markets Ltd, is authorized and regulated by the Financial Services Commission “FSC” of Mauritius as an Investment Dealer (Full-Service Dealer, excluding Underwriting) (license No. GB 23201593). The registered office address: 2nd Floor, The Catalyst, 40 Silicon Avenue, Ebene Cybercity, 72201, Mauritius.
Disclaimer
Comments, news, research, analysis, price, and all information contained in the article only serve as general information for readers and do not suggest any advice. Ultima Markets has taken reasonable measures to provide up-to-date information, but cannot guarantee accuracy, and may modify without notice. Ultima Markets will not be responsible for any loss incurred due to the application of the information provided.
Copyright © 2023 Ultima Markets Ltd. All rights reserved.