Focus on Copper today.
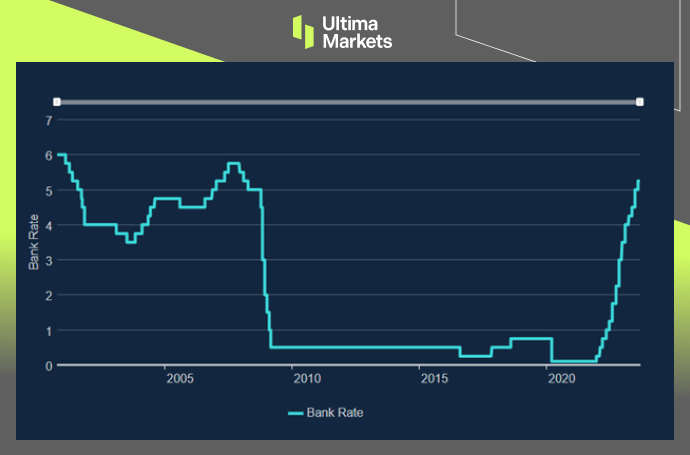
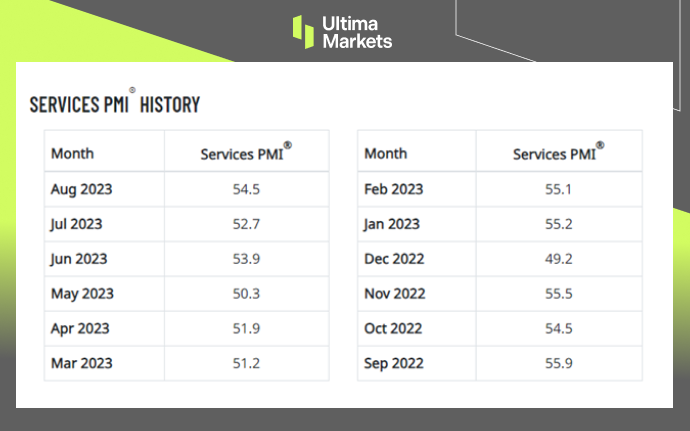
Fundamentally, after the release of employment data and PMI data, metals are still under pressure due to potential secondary inflation risks in the United States. On the supply side, according to the latest statistics from the London Metal Exchange, copper inventories increased by 3,150 tons. The increase in inventories means that market demand has not expanded. These short-term news still did not lead to a significant decline in copper prices, suggesting that short-term copper still has room for long-term gains after digesting the market news.
Technically, copper prices are once again close to the 200-week moving average on a weekly basis, and the market showed signs of resistance and rebound in the first two times.
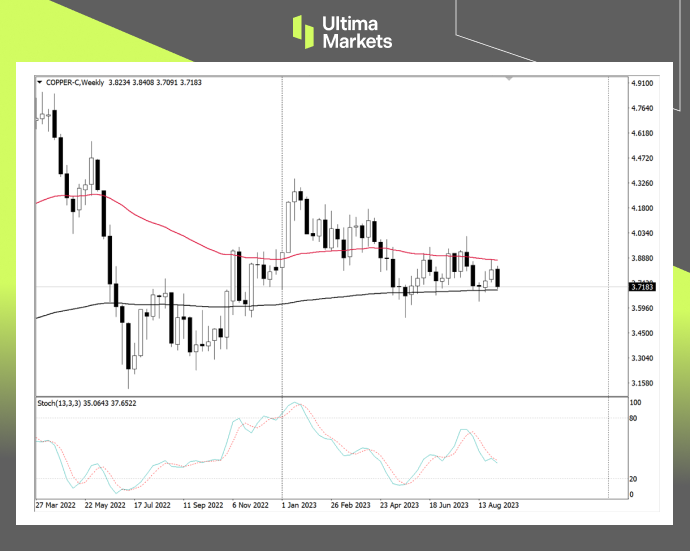
(Weekly chart of Copper, source: Ultima Markets MT4)
The 65-week moving average continues to suppress the upper rebound space of copper prices. Pay attention to whether the final closing price of the market today on Friday can effectively break the 200-week moving average. The market deserves to focus on the short trend next week.
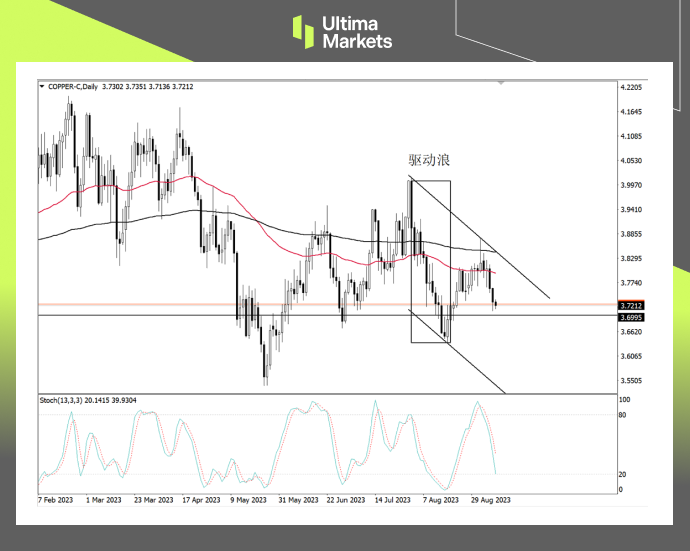
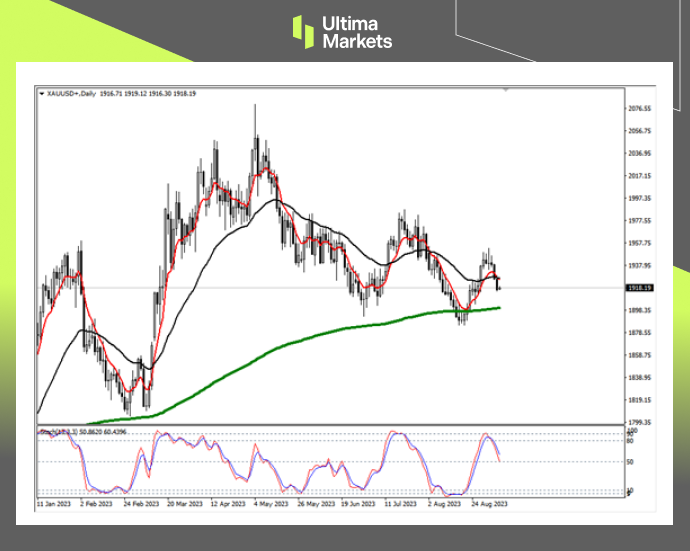
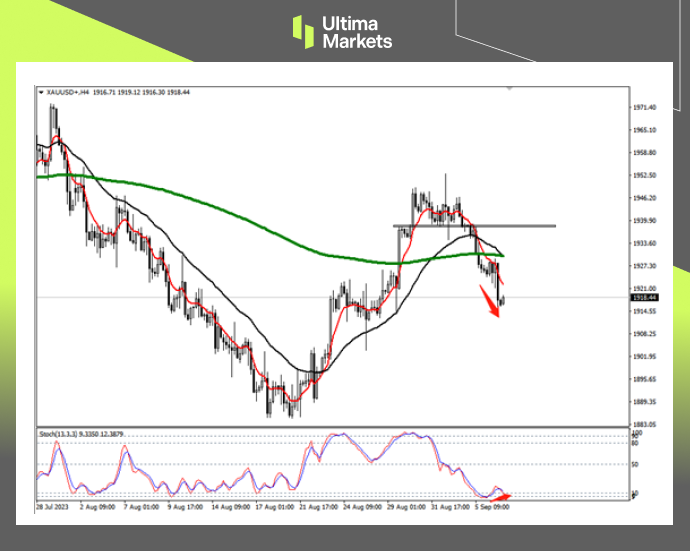
(Daily chart of Copper, source: Ultima Markets MT4)
The short forces on the copper daily cycle temporarily have the upper hand. The stochastic oscillator crosses downwards. Since the downward trend since early August has been a downward motive wave, there is a certain probability that the recent decline will continue the extended downward trend.
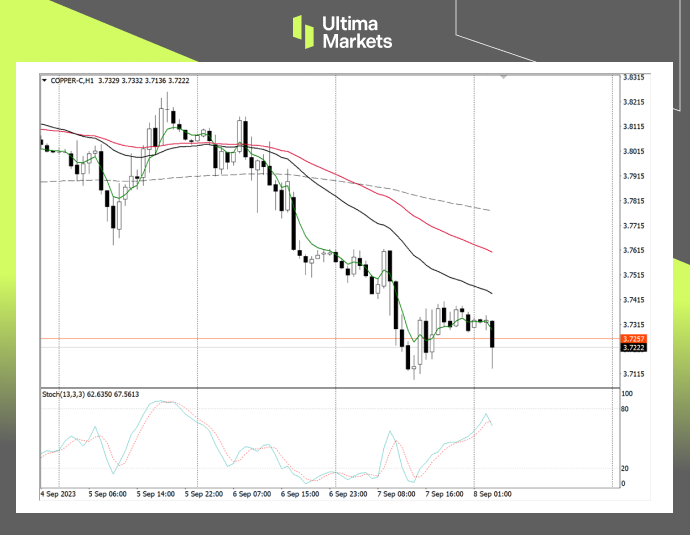
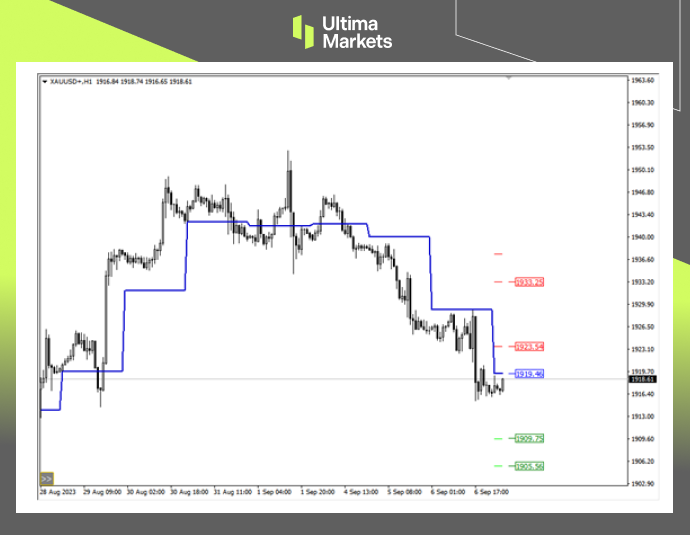
(1-hour chart of Copper, source: Ultima Markets MT4)
On the intraday 1-hour period, the stochastic oscillator has not entered the overbought area for the time being, and the market is still likely to be a mess. Even if the Asian market is currently falling, we need to wait for the short signal of the stochastic oscillator indicator to be confirmed, and then wait for the breakthrough of the low before we can focus on intraday short trading opportunities.
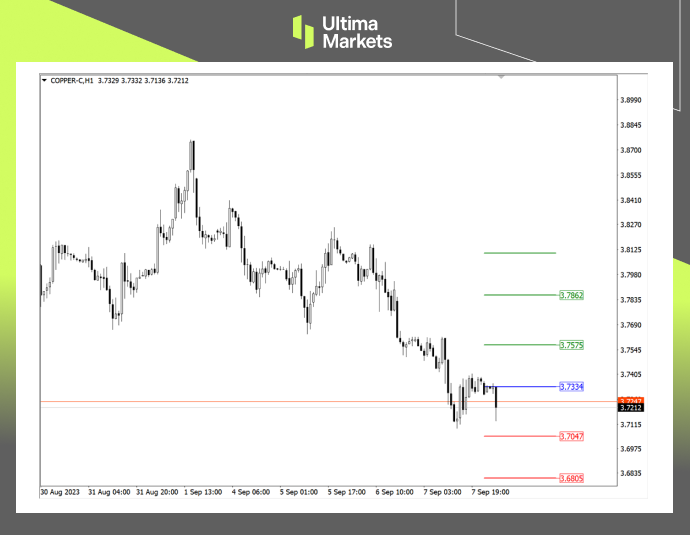
(1-hour chart of Copper, source: Ultima Markets MT4)
According to the pivot indicator in Ultima Markets MT4, the pivot price of the day is 3.7334.
Bullish above 3.7334, first target 3.7575, second target 3.7862
Bearish below 3.7334, first target 3.7047, second target 3.6805.
Disclaimer
Comments, news, research, analysis, prices and other information contained in this article can only be regarded as general market information, provided only to help readers understand the market situation, and do not constitute investment advice. Ultima Markets will not be responsible for any loss or loss (including but not limited to any loss of profits) that may arise from the direct or indirect use or reliance on such information.