Important Information

You are visiting the website that is operated by Ultima Markets Ltd, a licensed investment firm by the Financial Services Commission “FSC” of Mauritius, under license number GB 23201593. Please be advised that Ultima Markets Ltd does not have legal entities in the European Union.

If you wish to open an account in an EU investment firm and protected by EU laws, you will be redirected to Ultima Markets Cyprus Ltd (the “CIF”), a Cyprus investment firm duly licensed and regulated by the Cyprus Securities and Exchange Commission with license number 426/23.

Use Forex Hedging to Minimize Risks

As a forex trader, the strategy of forex hedging is a must-know, which serves as a shield against market uncertainties in CFD trading. So, what exactly is forex hedging? It is like waring a bulletproof vest, a strategy to protect your trades from potential losses. By opening additional trades that offset the risk of your primary positions, forex hedging acts like a safety net.

Here are some popular hedging strategies worth mentioning:

  • Using multiple currency pairs:

Think of yourself as a savvy investor spreading your investments across various assets. When you trade multiple currency pairs simultaneously, you can reduce your overall risk. For example, if you have a long position in one currency pair and expect it to rise, you might take a short position in another currency pair you believe will fall. This way, if one trade goes sour, the other might cover your losses.

  • Options trading:

To be a seasoned trader, you need to always get ready for a plan B. Options trading gives you the right (but not the obligation) to buy or sell an asset at a specific price on or before a certain date. With options, you can limit potential losses while still benefiting from market movements. It’s like having an insurance policy for your trades.

  • Correlation strategy:

The correlation strategy involves trading assets that have a positive or negative relationship. For example, some currency pairs tend to move in the same direction, while others move in opposite directions. By recognizing these correlations, you can hedge your positions and mitigate risks.

Summary

By employing various hedging strategies, you can protect your trades from unexpected market movements to minimize risks. Diversifying with multiple currency pairs, exploring options trading, and spotting correlations can all be part of your hedging arsenal.

How to Use Expert Advisor for Forex Trading

Imagine a trader who never sleeps, never gets emotional, and follows the strategies set by you consistently. If that is your dream, then you have to know the world of Expert Advisors (EAs). Think of EA as your virtual trading assistant. This assistant is a computer program that automatically executes trades based on the strategies you set. It’s like having a personal robot that follows your commands in the trading arena.

  • Choose and customize your EA wisely:

Choosing the right EA is crucial. You’ll find various EAs with different strategies, such as trend following, scalping, grid trading, and many others. You can also customize EAs to execute trades according to your strategy. No matter which type of strategy you set, your EA will always follow your rules.

  • Backtesting:

EA allows you to backtest your trading strategy using historical data. This helps you see how your strategy would have performed in the past. It’s like watching the replay of a sports game to improve your tactics.

  • Monitor and optimize:

Although EA does the trades for you, you still need to keep an eye on it. Regularly monitor your EA’s performance and be ready to make adjustments. When the market changes, your EA might also need a little tweak. While EAs are awesome, they’re not fortune tellers. So, stay informed about global news, economic data releases, and market sentiment.

Summary

EAs can automate your strategies, save your time, and help you stick to your plan. By choosing the right EA and customizing your strategy, you can harness the potentials of EAs and take your trading game to the next level.

Beginner’s Guide to Forex Trading Strategies

Trading strategies are like your playbook. They guide your trading decisions and help you navigate the ever-changing markets. Let’s jump in and explore some beginner-friendly trading strategies that can make a big difference in your trading journey.

  • Trend following:

Trend following is like riding the market waves. You need to look for a trend, whether it’s going up or down, and then jump in. Think of it as joining a parade: you are moving with the flow. You might use moving averages or trendlines to spot these trends. But remember, even the most promising trends may reverse all of a sudden. So, make sure to set stop-loss orders to protect your gains.

  • Breakout strategy:

Breakout strategy is all about spotting when an asset’s price breaks through a certain level. This can be a support or resistance level. When prices break through, it can signal a new trend or a big price move. It’s exciting and potential profitable.

  • News trading:

News trading involves reacting to significant economic events or news releases. When big news hits, prices of assets can move like a roller coaster. Be cautious through, because news trading is high-risk and requires quick decision-making.

Summary

Remember, there’s no one-size-fits-all strategy. What works for one might not work for another. As a beginner, start with one strategy and practice on a demo account. Learn the ins and outs, test different approaches, and discover what suits your style.

Key Indicators in Technical Analysis

If you have read our article “Basic Types of Charts in Technical Analysis”, now it’s time to unlock the secret with technical analysis indicators. Let’s dive in!

  • Moving Averages:

Moving averages calculate the average price of a currency pair or any other asset over a specific period, such as 10 days or 50 days, to reveal the trend. By plotting these averages on a chart, you can easily spot if prices are going up or down. They help you identify potential buy or sell signals to make trading decisions like a pro!

  • Relative Strength Index (RSI):

RSI helps you measure the strength and momentum in the markets. This oscillator ranges from 0 to 100. When it goes above 70, it suggests the asset might be overbought. On the contrary, when it drops below 30, it indicates the asset might be oversold.

  • Bollinger Bands:

Bollinger bands are like dynamic rubber bands hugging the price chart. They consist of a moving average line in the middle, with two bands above and below, representing standard deviations from the average. When the price moves close to the bands, it could mean a surge in volatility. Bollinger Bands are perfect for identifying potential price breakouts or reversals so that you won’t miss those exciting trading moments!

Summary

You can combine these indicators to build your trading superpower! For example, you might use moving averages to spot trends, RSI to identify overbought or oversold conditions, and Bollinger Bands to confirm potential breakouts. The possibilities are endless, and by blending different indicators, you can develop your own unique trading strategy.

Introduction to Technical Analysis in Forex Trading

Technical analysis in forex trading is like solving a puzzle using historical price data. It helps us understand the past and make predictions about the future.

What is Technical Analysis?

By studying these puzzle pieces—patterns, trends, support and resistance, and using indicators—we can make predictions about future price movements. But remember, technical analysis is not foolproof. It’s like a game of probabilities, where we use historical clues to make educated guesses about what might happen next. It’s important to combine technical analysis with other forms of analysis, like understanding economic news and managing risks.

By learning technical analysis, people can develop a better understanding of how prices move in the forex market and use this knowledge to make more informed trading decisions. It’s like being a detective, solving puzzles and making predictions based on the clues we find in the charts. Just like any skill, practice and continuous learning are key to becoming better at technical analysis.

Key Components of Technical Analysis

As we mentioned above, traders rely on various clues from the past to predict the future. And here are some key clues frequently used to make predictions:

  • Price charts:

Price charts show the historical prices of a currency pair, like a line graph or candlestick chart. These charts display the ups and downs in currency prices over time.

  • Patterns and trends:

Traders look for patterns and trends in the price charts. They observe how prices have moved in the past to identify similar patterns that might happen in the future. For example, they might notice that every time the price goes up a certain amount, it tends to come back down, or vice versa. These patterns are used to predict when the price might go up or down next.

  • Indicators:

Traders use indicators, which are special calculations based on price data, to obtain more market information. For example, they might use moving averages, which show the average price over a certain period, to identify trends. They can also use oscillators, which help determine if a currency is overbought or oversold.

Summary

  • Traders can make predictions about future price movements by relying on technical analysis.
  • Technical analysis consists of many key components, such as price charts, patterns and trends, and indicators.

Basic Types of Charts in Technical Analysis

If you have read our article “Introduction to Technical Analysis”, then you must be aware of the significance of technical analysis, which is used by master traders to predict the ups and downs of the financial markets. In this article, we are going to lift the curtain on the myth of technical analysis: Charts!

  • Line charts:

Let’s start with the most beginner-friendly chart: the line chart. Line charts display the closing prices of a currency pair, stock, crypto, or any other type of financial asset, over a specific time frame, and these price dots are connected with a line.

This straightforward chart gives a clear picture of price movements, convenient for you to take a quick glance at the market’s overall trend.

  • Candlestick charts:

Candlestick charts are like little rectangles with wicks on top and bottom. These candles stand for price movements within a specific time period (maybe an hour or a day). The body of the candle indicates the opening and closing prices, while the wicks reveal the highest and lowest prices during that time. By taking advantage of candlestick charts, you can access more details about the magnitude of price movements.

  • Bar charts:

Bar charts resemble vertical lines with small dashes on each side. The top dash represents the highest price, the bottom dash the lowest price, and the vertical line the opening and closing prices. Sounds like candlestick charts? That’s right. Bar charts are just like cousins of candlestick charts, providing similar information with just a slightly different look.

Summary

Charts help us unravel patterns, trends, and potential price movements. By analyzing these charts, you can make reasonable predictions about where prices might head next, giving you a competitive edge in CFD trading. Charts are your trusty companions to embark on the thrilling journey of trading.

Why FOMC Meeting Is Important for Your Trading

First things first, FOMC stands for the Federal Open Market Committee. Think of it as the mastermind behind the scenes, making decisions that can send shockwaves through the financial markets. In this article, we are going to walk you through the FOMC Meeting, and explain why it is a big deal for you.

  • Interest rate decision:

Imagine you are at an amusement park, and the FOMC is controlling the speed of the roller coaster. Interest rates are just like the gas pedal for the economy. When the FOMC decides to raise interest rate, borrowing money becomes more costly. This can cool down an overheated economy and tame inflation. On the other hand, when they lower interest rates, borrowing money becomes cheaper, thereby boosting spending and investment. These rate decisions can jolt the values of currency pairs, stocks, or commodities.

  • Market mood:

Experienced traders tend to analyze every word the FOMC utters during the meeting to predict what’s coming next. If the FOMC hints at rate hikes, traders might expect currency values to rise. If they signal rate cuts, stock prices might skyrocket. You may grab a competitive edge by hunting for clues from their statement.

  • Volatility swing:

FOMC meetings can feel just like a roller coaster. Currencies might leap, stocks can soar or plummet, and commodities might go on a wild ride. The thrilling volatility may catch inexperienced traders off guard. That’s why knowing when the FOMC is meeting and preparing for their announcements is a savvy move.

Summary

In a nutshell, FOMC decisions about interest rates will impact economies and market expectations, and send waves around the globe. For CFD traders, knowing these meetings and how they can shape the markets will give you an upper hand.

Key Fundamental Factors Affecting the Financial Market

Fundamental factors are like puzzle pieces that shape the big picture of the financial world. These factors can influence the value of assets such as currency pairs, stocks, commodities, and even cryptos. In this article, we will uncover such key factors, which often create opportunities for intelligent investors and traders.

  • Geopolitical events:

Geopolitical factors like wars, elections, trade deals, or conflicts can cause ripples in the markets. Positive events can boost investor confidence, while negative news can trigger uncertainty. You are highly recommended to stay updated on global affairs to anticipate how they might impact your trades.

  • Economic indicators:

Economic indicators are like the scoreboard, showing the health of a country’s economy. When GDP (Gross Domestic Product) goes up, it’s a sign of economic strength. Low unemployment rates mean people have jobs and money to spend. Inflation, the rise in prices, affects consumers’ buying power. And interest rates set by central banks can make borrowing cheaper or pricier. These indicators affect market sentiment, and understanding them gives you an edge.

  • Corporate earnings:

Corporate earnings can reveal how well a company is doing. Strong earnings mean the company is making money, which can lead to higher stock prices. Keep an eye on quarterly reports and profit margins – they’re your insider’s ticket to predicting movements of stocks and indices.

  • Natural disaster or climate events:

Imagine you’re a scientist observing nature’s forces. Natural disasters like hurricanes, earthquakes, or droughts can disrupt supply chains and affect commodity prices. Climate events, like changing weather patterns, impact agricultural products. Keeping an eye on these factors helps you anticipate potential market shifts.

  • Market sentiment:

Imagine you’re a scientist observing nature’s forces. Natural disasters like hurricanes, earthquakes, or droughts can disrupt supply chains and affect commodity prices. Climate events, like changing weather patterns, impact agricultural products. Keeping an eye on these factors helps you anticipate potential market shifts.

Summary

By understanding fundamental factors, you can predict how the market might change. For example, if an economic indicator suggests a strong economy, you might expect stock prices to rise. If geopolitical tensions increase, currencies might fluctuate.

In a word, fundamental factors are the driving forces behind price movements. Understanding them will give you a competitive edge.

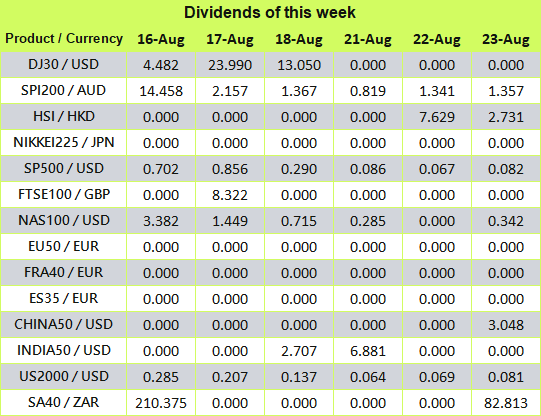
Ultima Markets Index Dividend Adjustment Notice

When you are trading in Contracts for Difference (CFDs) on spot stock indices, if a component of the underlying stock index pays a dividend/dividend (payout) to its shareholders, your trading account will be adjusted ex-dividend at 00:00 server time on the same day, and the corresponding gain or expense will occur depending on the position you are holding and will be reflected in the account history.

• The above data are expressed in the base currency of each index.

• According to market practice, the actual execution data may change, please refer to MT4 software for details.

When the stock index goes ex-dividend, the dividend will be adjusted in the form of fund deduction.

You can view the fund deduction record with the following annotation “Div & stock index name & net lot” in the account history,It is the dividend adjustment. The long lot is calculated as a “positive value”, and the short lot is calculated as a “negative value”. The sum of the two is the “net lot”.

An example is as follows.

If you trade more than 5 lots of DJ30, you can view the “Div & DJ30 & 5” dividend adjustment record in the form of balance in the account history; View the “Div & DJ30 & -5” dividend adjustment records in the form of balance.

We recommend that you carefully evaluate your current positions and consider whether to hold it overnight.

If you have any questions or require assistance, please do not hesitate to contact [email protected]

Introduction to Fundamental Analysis

If you are eager to understand the magic behind the financial markets, look no further than fundamental analysis! It’s time to unlock this exciting aspect of CFD trading and show you how to take advantage of it like a pro.

What Is Fundamental Analysis?

Fundamental analysis is all about exploring the real factors that drive the prices of financial assets like currency pairs, stocks, commodities, or cryptos. Unlike technical analysis, fundamental analysis focuses on the big picture, considering economic, financial, and geopolitical factors that influence an asset’s value.

Key Factors in Fundamental Analysis

  • Geopolitical Events:

Geopolitical events, like elections, trade deals, or conflicts, can cause turbulence in the financial markets. They play a role in shaping investors’ confidence and affecting asset prices. Keep an eye on global news and how it impacts the markets.

  • Economic Indicators:

Economic indicators are like clues that help you understand the health of a country’s economy. Key indicators include GDP (Gross Domestic Product), employment rates, inflation, and interest rates. When these indicators show a strong economic signal, asset prices might rise. But if they reveal weakness, prices could fall.

  • Company Performance:

If you’re trading CFDs on individual stocks, it’s essential to investigate the companies behind them. Look into their financial reports, earnings, and growth prospects. A company with solid earnings and exciting projects may attract more investors, boosting its stock price. But beware of companies facing challenges, their stock prices might take a dip.

Summary

Fundamental analysis is key to revealing the hidden treasures of the financial markets. It can help you understand the true value of assets and the factors that drive their prices. By combining fundamental analysis with technical analysis, you will be well-equipped to tackle the thrilling world of CFD trading.