Comprehensive USD/CAD for October 25, 2023
In this comprehensive analysis, Ultima Markets brings you an insightful breakdown of the USD/CAD for 25th October 2023.
Key Takeaways
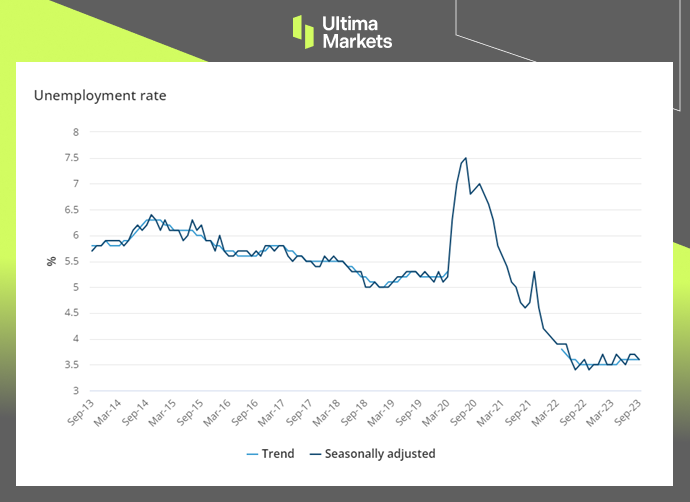
- BOC is to maintain interest rate: The weak Canadian retail sales data suggests that Canada’s tightening monetary policy has shown results. The Bank of Canada will most likely keep overnight interest rates unchanged at 5.00% tonight.
- BOC even has pressure to cut interest rates: Canada’s GDP in the third quarter grew at an annual rate of only 0.2%, far lower than the 1.5% growth predicted by the Bank of Canada. The Bank of Canada will cut interest rates to ease the economic downturn in the future. The market expects the overnight rate to drop to 4.75% or lower by the end of the second quarter of 2024.
- Pay attention to the forward guidance: The Bank of Canada’s interest rate path for the year has basically been clear. Focus on the Bank of Canada’s forecast of the economy and interest rate levels in 2024. If it shows a hawkish attitude, be wary of the appreciation trend of the Canadian dollar tonight.
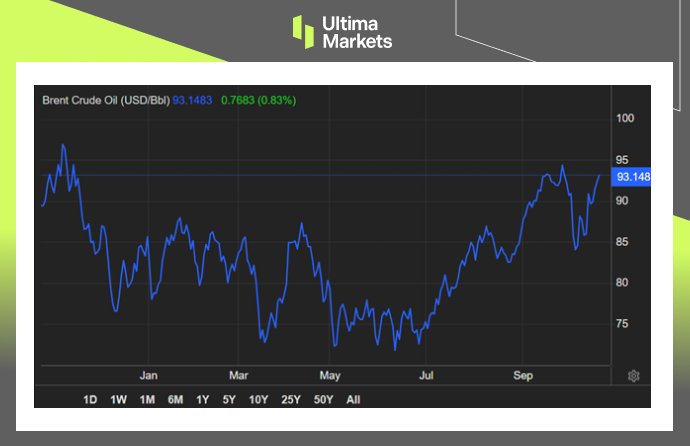
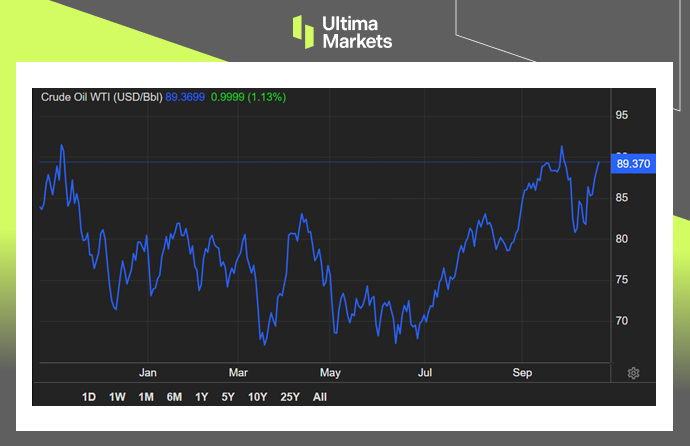
- Oil prices drive the depreciation of the Canadian dollar: The price of crude oil fell rapidly after risk aversion gradually subsided, and the Canadian dollar was under pressure to depreciate. If oil prices continue to decline, the USD/CAD may continue to rise.
USD/CAD Technical Analysis
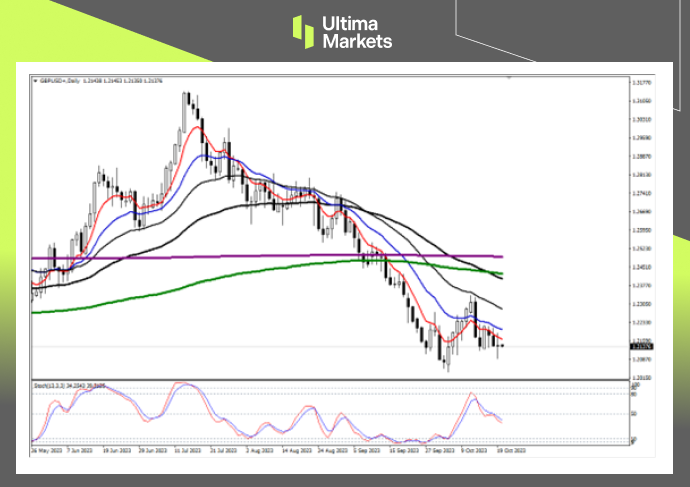
USD/CAD Daily Chart Insights
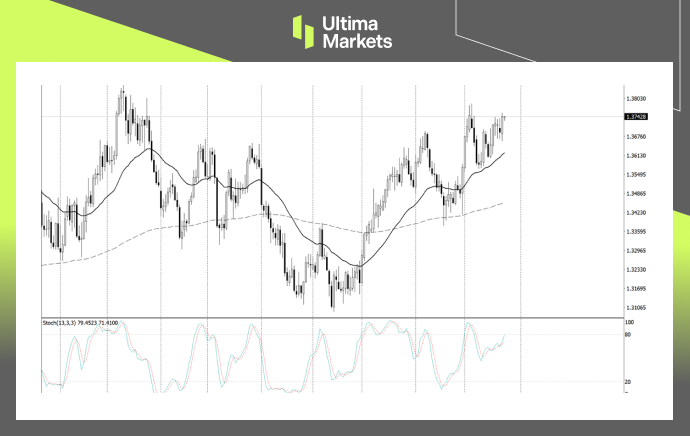
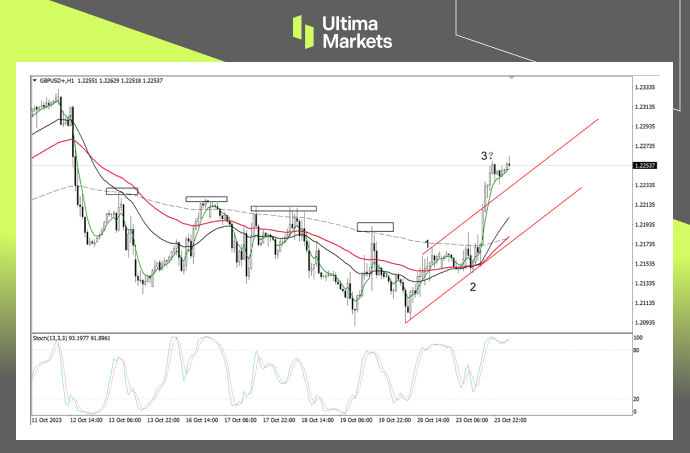
- Stochastic Oscillator: Although the fast line once again exceeded the slow line yesterday, the indicator has been relatively volatile since mid-October. The current upward trend is more like an adjustment trend, and it needs to wait for the exchange rate to break through the key price level to be confirmed.
- Price Action: The three consecutive candle bars starting on October 5 are a clear downward trend. Therefore, even if the market is rising in the short term, as long as it does not break through the high point of the pin bar on October 5, it cannot be considered as the arrival of bulls.
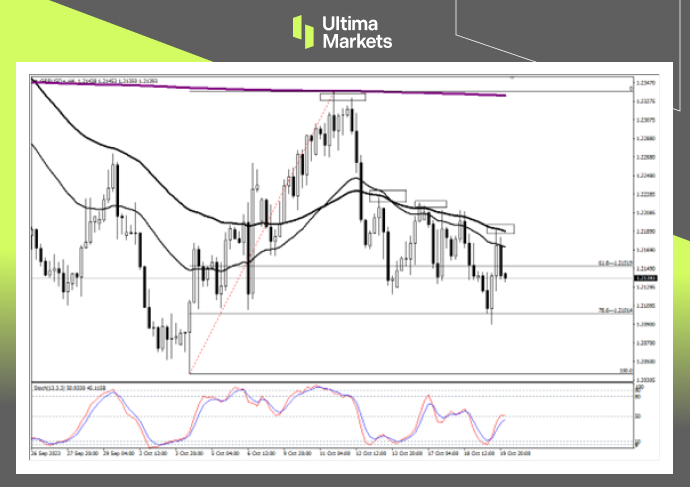
USD/CAD 4-hour Chart Analysis
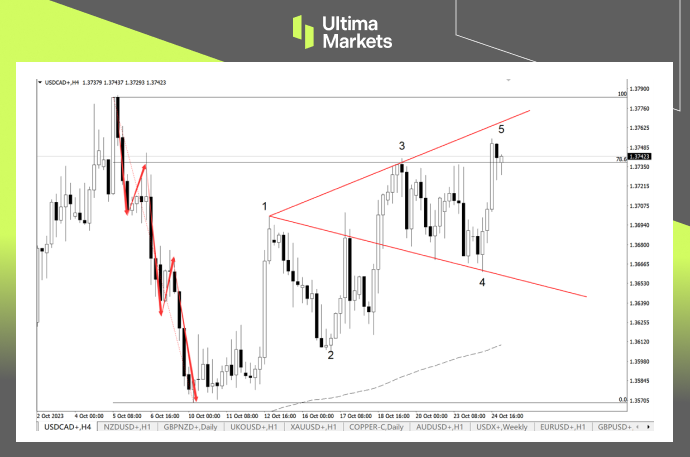
- Wolfe wave pattern: The upward trend since October 10 has been relatively volatile, and the market trend currently forms a typical Wolfe wave pattern. Wait for point 5 to touch the upper extension line, then the market price will most likely form a short trend.
- Elliot Wave Theory: The rapid decline since October 5 is a downward driving wave with a 5-wave structure. The rise since October 10 is temporarily determined to be a corrective wave. Only when the market price breaks through 1.37851, can it be confirmed that the downward driving wave is incorrect.
- Fibonacci retracement: The market price broke through the 78.6% retracement of the downward trend, and there was a pullback during the US trading session yesterday. There is a certain probability that the exchange rate will rise. If a clear bearish candlestick pattern appears, the market may move lower quickly.
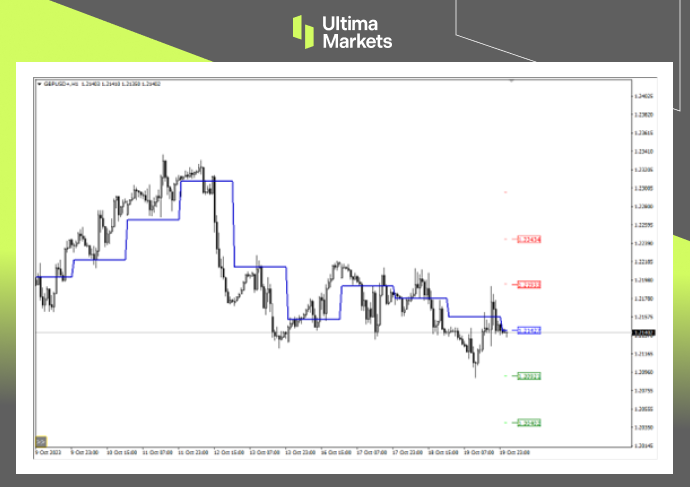
Ultima Markets MT4 Pivot Indicator
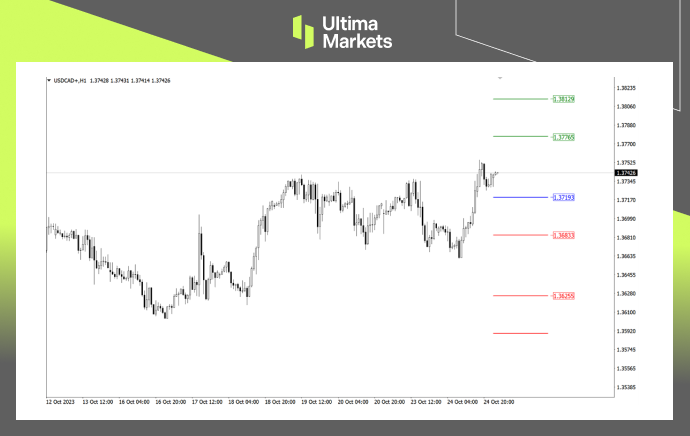
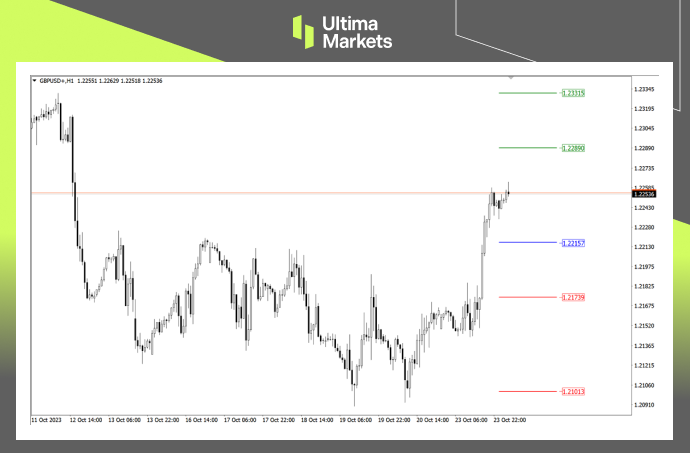
- According to the pivot indicator in Ultima Markets MT4, the central price of the day is established at 1.37193,
- Bullish Scenario: Bullish sentiment prevails above 1.37193, first target 1.37765, second target 1.38129;
- Bearish Outlook: In a bearish scenario below 1.37193, first target 1.36833, second target 1.36255.