Important Information

You are visiting the website that is operated by Ultima Markets Ltd, a licensed investment firm by the Financial Services Commission “FSC” of Mauritius, under license number GB 23201593. Please be advised that Ultima Markets Ltd does not have legal entities in the European Union.

If you wish to open an account in an EU investment firm and protected by EU laws, you will be redirected to Ultima Markets Cyprus Ltd (the “CIF”), a Cyprus investment firm duly licensed and regulated by the Cyprus Securities and Exchange Commission with license number 426/23.

Ultima Markets Index Dividend Adjustment Notice

When you are trading in Contracts for Difference (CFDs) on spot stock indices, if a component of the underlying stock index pays a dividend/dividend (payout) to its shareholders, your trading account will be adjusted ex-dividend at 00:00 server time on the same day, and the corresponding gain or expense will occur depending on the position you are holding and will be reflected in the account history.

• The above data are expressed in the base currency of each index.

• According to market practice, the actual execution data may change, please refer to MT4 software for details.

When the stock index goes ex-dividend, the dividend will be adjusted in the form of fund deduction.

You can view the fund deduction record with the following annotation “Div & stock index name & net lot” in the account history,It is the dividend adjustment. The long lot is calculated as a “positive value”, and the short lot is calculated as a “negative value”. The sum of the two is the “net lot”.

An example is as follows.

If you trade more than 5 lots of DJ30, you can view the “Div & DJ30 & 5” dividend adjustment record in the form of balance in the account history; View the “Div & DJ30 & -5” dividend adjustment records in the form of balance.

We recommend that you carefully evaluate your current positions and consider whether to hold it overnight.

If you have any questions or require assistance, please do not hesitate to contact [email protected]

9.19 Metal Daily XAU/USD 

Focus on XAU/USD today. 

Fundamentally, there has been a large divergence between China’s domestic gold prices and international gold prices recently, but the bullish drive for domestic gold is mostly due to the depreciation of the local currency and the impact of restrictions on gold imports. It is difficult for international gold prices to be driven by this, but as the monetary policies of various countries come to an end, in line with expectations of falling inflation and economic downturn, international gold prices have certain upward momentum. At present, the market still needs a stimulus to allow gold prices to start a long-term bull trend again. 

Technically, the cross of the stochastic oscillator on the gold daily chart has been established, suggesting the arrival of a bullish trend. 

( Daily chart of XAU/USD, source: Ultima Markets MT4) 

The market has ushered in a rebound trend since it hit the 200-day moving average last Thursday. However, it is worth noting that the top is about to hit the downward trend line, and the remaining rebound space is relatively narrow. 

(4-hour chart of XAU/USD, source: Ultima Markets MT4) 

On the 4-hour chart, the stochastic oscillator has entered the overbought zone, suggesting that potential gold bulls may be blocked. However, judging from the chart, after the market hit the 200-period moving average, the large entity of candle bar broke through the consolidation range since last Friday, and there is a high probability that the bullish trend will continue in the Asian session.

 (1-hour chart of XAU/USD, source: Ultima Markets MT4) 

According to the pivot indicator in Ultima Markets MT4, the central price of the day was 1930.16. 

Bullish above 1930.16, the first target is 1937.62, and the second target is 1941.74 

Bearish below 1930.16, first target 1925.98, second target 1918.40 

Disclaimer 

Comments, news, research, analysis, prices and other information contained in this article can only be regarded as general market information, provided only to help readers understand the market situation, and do not constitute investment advice. Ultima Markets will not be responsible for any loss or loss (including but not limited to any loss of profits) that may arise from the direct or indirect use or reliance on such information. 

Navigating Reduced Holiday Spending Amid Economic Uncertainty


Mastering Holiday Spending in Times of Economic Uncertainty

A new CNBC-Morning Consult survey has found that 92% of adults have reduced their spending over the past six months, and plan to spend less through the holidays. 


The Core Insight

Consumers remain cautious in their spending due to job insecurity and inflation. The most common categories for spending cuts over the past six months were clothing and apparel (63%), restaurants and bars (62%), and entertainment outside the house (56%), a pattern that held steady from our June survey. The next biggest categories for cuts were groceries (54%), recreational travel and vacations (53%), and electronics (50%.) 

Looking ahead to the holiday shopping season, a warning for retailers: More than three-quarters of all U.S. adults surveyed (76%) plan to cut back on spending for non-essential items, and 62% expect to cut back on essential items “sometimes” or “more often” over the next six months, the survey found. 

Just how acutely consumers reported feeling the impact of the current economic situation varied among socio-economic groups. And it wasn’t always those making the least that reported feeling most pinched. 


Impact Across Socio-Economic Groups

More than half (55%) of households earning $50,000 or less (lower-income) said they’re feeling the impact of the economy on their personal finances, while 61% of households with $50,000 to $100,000 (middle-income) and 46% of households making at least $100,000 (higher-income) reported the same. 

However, Higher-income households are in fact moving toward feeling that the economic situation is having a positive impact, the survey reports 30% in September, up from 21% in June. 


Conclusion

In light of the economic uncertainty, a significant portion of Americans is adjusting their spending habits, especially as they approach the holiday season.

While these changes in consumer behavior pose challenges, they also offer opportunities for individuals to reevaluate their financial priorities and develop prudent spending habits.

By following these strategies and adapting to the current economic landscape, you can make the most of the holiday season while safeguarding your financial well-being.


Disclaimer  

Comments, news, research, analysis, price, and all information contained in the article only serve as general information for readers and do not suggest any advice. Ultima Markets has taken reasonable measures to provide up-to-date information, but cannot guarantee accuracy, and may modify without notice. Ultima Markets will not be responsible for any loss incurred due to the application of the information provided. 

Ultima Markets Index Dividend Adjustment Notice

When you are trading in Contracts for Difference (CFDs) on spot stock indices, if a component of the underlying stock index pays a dividend/dividend (payout) to its shareholders, your trading account will be adjusted ex-dividend at 00:00 server time on the same day, and the corresponding gain or expense will occur depending on the position you are holding and will be reflected in the account history.

• The above data are expressed in the base currency of each index.

• According to market practice, the actual execution data may change, please refer to MT4 software for details.

When the stock index goes ex-dividend, the dividend will be adjusted in the form of fund deduction.

You can view the fund deduction record with the following annotation “Div & stock index name & net lot” in the account history,It is the dividend adjustment. The long lot is calculated as a “positive value”, and the short lot is calculated as a “negative value”. The sum of the two is the “net lot”.

An example is as follows.

If you trade more than 5 lots of DJ30, you can view the “Div & DJ30 & 5” dividend adjustment record in the form of balance in the account history; View the “Div & DJ30 & -5” dividend adjustment records in the form of balance.

We recommend that you carefully evaluate your current positions and consider whether to hold it overnight.

If you have any questions or require assistance, please do not hesitate to contact [email protected]

ECB’s Recent Interest Rate Hike: A Closer Look at Implications

The European Central Bank’s Recent Interest Rate Hike and Its Impact on the Euro

The European Central Bank (ECB) raised the three key interest rates by 25 bps.

Starting from September 20, 2023, the marginal lending facility, main refinancing operations, and deposit facility will increase to 4.75%, 4.50%, and 4.00% respectively, setting a record since the euro was introduced in 1999. 

(Latest ECB interest rate, ECB) 


A Historic Interest Rate Shift in ECB

The ECB raised the benchmark interest rate from a historical low of -0.5% to the current record high in 20 years and 14 months.

Although Eurozone inflation has cooled, reaching 5.3% in August, the same as in July, it is still far beyond the 2% target. Rising interest rates put pressure on the euro, which fell to its lowest level against the dollar in five months. 

(EUR /US YTD Chart) 


ECB’s Inflation Control and Economic Growth Prospects

European Central Bank President Christine Lagarde said at the press conference that inflation in the eurozone has been hovering at a high level for too long, core inflation is still too high, and food and energy costs continue to put upward pressure on prices.

She reiterated that the ECB is committed to bringing inflation back to its 2% target. At the same time, the economy is expected to grow by 0.7% this year, 1% next year, and 1.5% in 2025, which is lower than the previous forecast growth of 0.9%, 1.5%, and 1.6%. 


The Global Implications

The ECB’s move has not only had a profound impact on the Eurozone but has also sent ripples across the global financial landscape. It underscores the central bank’s unwavering commitment to achieving price stability, even at the expense of economic growth prospects.

In conclusion, the ECB’s decision to raise interest rates to their highest levels in over two decades is a clear signal of its determination to tackle inflation. While this move may have consequences for the Euro and economic growth in the short term, it demonstrates the central bank’s commitment to maintaining price stability in the Eurozone.


Disclaimer  

Comments, news, research, analysis, price, and all information contained in the article only serve as general information for readers and do not suggest any advice. Ultima Markets has taken reasonable measures to provide up-to-date information, but cannot guarantee accuracy, and may modify without notice. Ultima Markets will not be responsible for any loss incurred due to the application of the information provided. 

Ultima Markets Index Dividend Adjustment Notice

When you are trading in Contracts for Difference (CFDs) on spot stock indices, if a component of the underlying stock index pays a dividend/dividend (payout) to its shareholders, your trading account will be adjusted ex-dividend at 00:00 server time on the same day, and the corresponding gain or expense will occur depending on the position you are holding and will be reflected in the account history.

• The above data are expressed in the base currency of each index.

• According to market practice, the actual execution data may change, please refer to MT4 software for details.

When the stock index goes ex-dividend, the dividend will be adjusted in the form of fund deduction.

You can view the fund deduction record with the following annotation “Div & stock index name & net lot” in the account history,It is the dividend adjustment. The long lot is calculated as a “positive value”, and the short lot is calculated as a “negative value”. The sum of the two is the “net lot”.

An example is as follows.

If you trade more than 5 lots of DJ30, you can view the “Div & DJ30 & 5” dividend adjustment record in the form of balance in the account history; View the “Div & DJ30 & -5” dividend adjustment records in the form of balance.

We recommend that you carefully evaluate your current positions and consider whether to hold it overnight.

If you have any questions or require assistance, please do not hesitate to contact [email protected]

Data Revealing the Solid U.S. Economy Before Fed Meeting 

Unveiling the Robust U.S. Economic Landscape Ahead of the Federal Reserve Meeting

The Bureau of Labor Statistics released three statistical reports on September 14: 

1. Retail sales 

U.S. retail sales in August increased by 0.1% on a monthly basis higher than market expectations, and the annual growth rate increased from 2.6% to 2.5%. Retail sales in August were mainly driven by the sharp increase in gas station sales mom from 0.1% to 5.2%, reflecting the rebound in oil prices.

Other categories also generally showed positive growth, with more significant increases including automobiles and parts from -0.4% to 0.3%, electronics Supplies -1.1%→0.7%, and dining out and catering 0.8%→0.3% showed a slowdown.

Overall, retail sales in August were partly due to the recovery in gasoline prices, but retail sales excluding automobiles and gasoline were also higher than market expectations. (0.2% vs. 0.1%), the control group dropped from 0.7% to 0.1%, which was still better than the market expectation of -0.1%, highlighting that the US consumer market is still strong. 

(Retail Sales data, BLS) 


2. Initial jobless claims 

Last week, the number of initial claims for unemployment benefits increased by 3,000 from 217,000 to 220,000, lower than the expected 225,000.

The number of continuing claims for unemployment benefits in the previous week increased by 4,000 from 1.684 million to 1.688 million, which was lower than the market estimate of 1.69 million people, showing that the job market is cooling more slowly than expected. 

(Initial Jobless Claims, BLS) 


3. PPI (Producer Price Index)

The August producer price index (PPI) increased by 1.6% year-on-year, higher than market expectations of 1.2% and the previous value of 0.8%, growing for the second consecutive month.

Excluding volatile food and energy prices, the August core PPI rose by 2.2% YoY, in line with market expectations and lower than the previous value of 2.4%.

The growth of PPI in August was mainly driven by rising energy and transportation costs.  

(Core PPI, BLS) 


Disclaimer  

Comments, news, research, analysis, price, and all information contained in the article only serve as general information for readers and do not suggest any advice. Ultima Markets has taken reasonable measures to provide up-to-date information, but cannot guarantee accuracy, and may modify without notice. Ultima Markets will not be responsible for any loss incurred due to the application of the information provided. 

9.15 FX Daily USD/CAD

Focus on USD/CAD today. 

Fundamentally, the continued rise in oil prices this week has driven market demand for the Canadian dollar and promoted the appreciation of the Canadian dollar. This has also made the implementation of the Bank of Canada’s monetary policy more difficult to a certain extent. In the short term, oil prices affect the appreciation trend of the Canadian dollar. However, as Canada’s real per capita GDP shrank year-on-year in the second quarter, the unemployment rate began to rise in May, and coupled with the continued drag on mortgage loan renewals, Canada’s price level may go downward. Therefore, if there are no unexpected changes in supply and demand in the crude oil market, it may be difficult to change the Bank of Canada’s stance of keeping interest rates unchanged at the October meeting.

Technically, the downward trend line on the weekly chart of USD/CAD effectively prevents the exchange rate from rising further. After encountering resistance last week, it has entered a downward trend this week. However, the stochastic oscillator has a clear short signal, and we need to wait for the final closing today. 

(Weekly chart of USD/CAD, source: Ultima Markets MT4) 

The market has started an upward trend since hitting the 200-week moving average in mid-August. Based on the complete five-wave structure of the entire upward trend, the current decline is temporarily judged to be an adjustment structure of the previous upward trend. After sufficient adjustment, the Canadian dollar may further depreciate. 

(Daily chart of USD/CAD, source: Ultima Markets MT4) 

On the daily chart, the rate has reached a very critical support position against the Canadian dollar. The market finally retreated after the stochastic oscillator signaled a double divergence. At present, it has fallen to near the 33-day moving average. The clear top structure means that the current support position is a strong resistance area, and bulls may usher in a “counterattack” in this area during the day. 

(1-hour chart of USD/CAD, source: Ultima Markets MT4) 

On the 1-hour chart, the oscillator also sent out a bottom divergence signal yesterday, and the market is likely to consolidate or rebound in the short term. If the market breaks through 1.35173 during the Asian session, traders can focus on rebound trading opportunities during the day. The first target is around the red 65 moving average. 

(1-hour chart of USD/CAD, source: Ultima Markets MT4) 

According to the pivot indicator in Ultima Markets MT4, the central price of the day was 1.35173. 

Bullish above 1.35173, the first target is 1.35422, the second target is 1.35789 

Bearish below 1.35173, first target 1.34816, second target 1.34570 

Disclaimer 

Comments, news, research, analysis, prices and other information contained in this article can only be regarded as general market information, provided only to help readers understand the market situation, and do not constitute investment advice. Ultima Markets will not be responsible for any loss or loss (including but not limited to any loss of profits) that may arise from the direct or indirect use or reliance on such information. 

Ultima Markets Index Dividend Adjustment Notice

When you are trading in Contracts for Difference (CFDs) on spot stock indices, if a component of the underlying stock index pays a dividend/dividend (payout) to its shareholders, your trading account will be adjusted ex-dividend at 00:00 server time on the same day, and the corresponding gain or expense will occur depending on the position you are holding and will be reflected in the account history.

• The above data are expressed in the base currency of each index.

• According to market practice, the actual execution data may change, please refer to MT4 software for details.

When the stock index goes ex-dividend, the dividend will be adjusted in the form of fund deduction.

You can view the fund deduction record with the following annotation “Div & stock index name & net lot” in the account history,It is the dividend adjustment. The long lot is calculated as a “positive value”, and the short lot is calculated as a “negative value”. The sum of the two is the “net lot”.

An example is as follows.

If you trade more than 5 lots of DJ30, you can view the “Div & DJ30 & 5” dividend adjustment record in the form of balance in the account history; View the “Div & DJ30 & -5” dividend adjustment records in the form of balance.

We recommend that you carefully evaluate your current positions and consider whether to hold it overnight.

If you have any questions or require assistance, please do not hesitate to contact [email protected]

The Surprising Rise in U.S. Inflation Data for August 2023


Understanding the Surprising Rise in U.S. Inflation Data

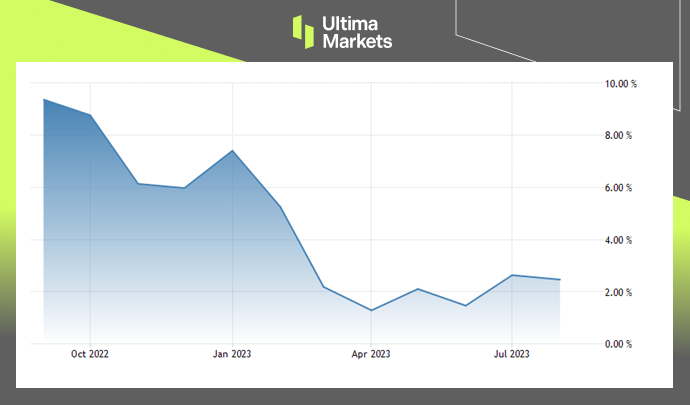
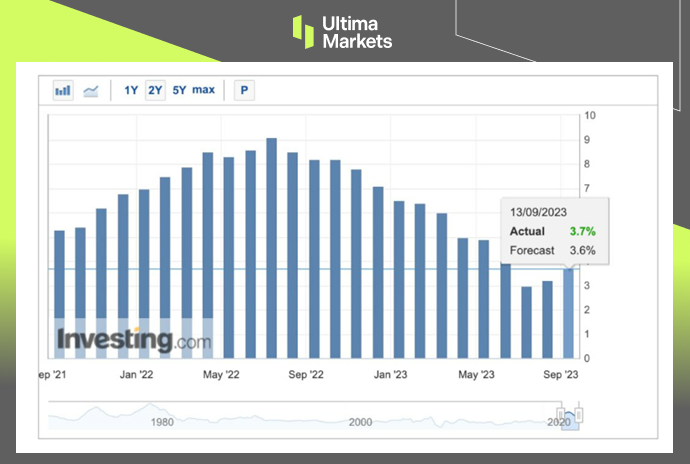
On September 13th, the U.S. Department of Labor (BLS) released the Consumer Price Index (CPI) in August increased by 3.7% year-on-year, slightly higher than the market estimate of 3.6%, and higher than the previous value of 3.2%.

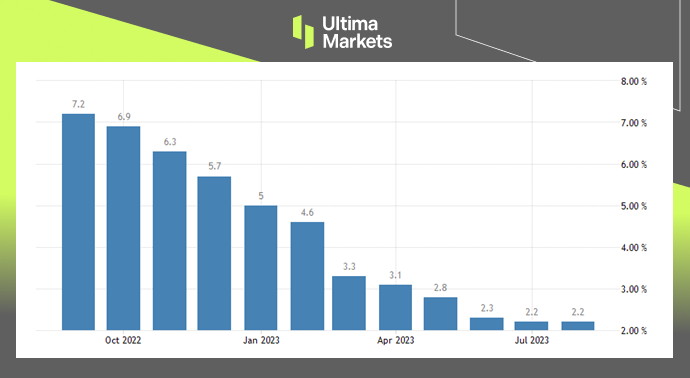
However, excluding food and energy Core CPI increased by 4.3% YoY, in line with market expectations and lower than the previous value of 4.7%. It was the smallest increase in the past two years, but it was still higher than the Fed’s 2% target. 

(U.S. Consumer Price Index CPI) 


Understanding the Drivers

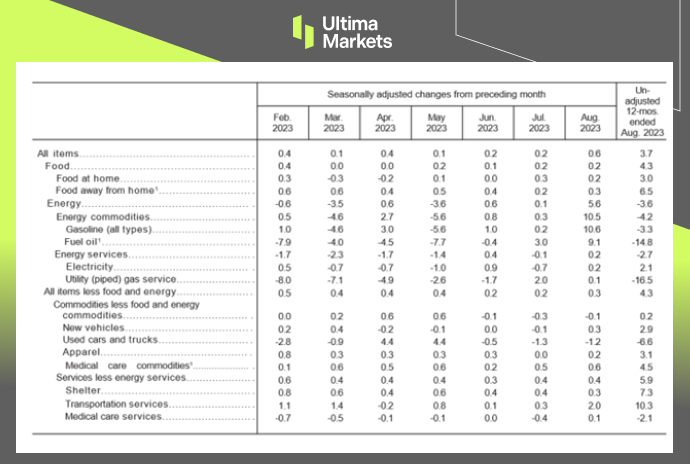
Examining the report details, energy was the main driver for the growth of CPI in August, accounting for more than half of the CPI increase. On a monthly basis, the growth rate of 5.6% was much higher than the 0.1% growth rate last month.

Separately, on an annual basis, housing prices increased by 7.3% in August, accounting for more than 70% of core CPI. However, the housing inflation rate is falling sharply, and the slowdown in growth has become more obvious.

In August, transportation (10.3%) beat housing for the first time and became the biggest driver of core CPI.

The production cuts by OPEC+ and the threat of strikes by the United Auto Workers against General Motors, Ford and Stellantis are all creating variables in the fight against inflation.  


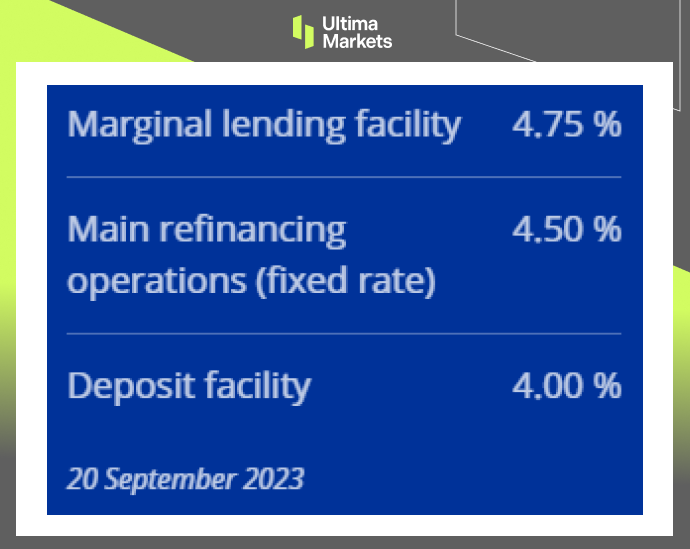
Implications for Monetary Policy

This CPI report is the last important economic data to be seen before the Fed’s monetary policy meeting next week.

CME Group The FedWatch Tool shows that the interest rate futures market predicts a 97% chance of keeping interest rates unchanged next week and only a 3% chance of raising interest rates by 25 bps.

However, the chances of keeping interest rates unchanged and raising interest rates by 1% at the November meeting are respectively 60% and nearly 40%. 

(Detailed classification MoM % & YoY%, US BUREAU OF LABOR STATISTICS ) 


Conclusion

In summary, the unanticipated rise in U.S. inflation data for August 2023 raises critical questions and concerns.

As we explore the drivers behind this increase and the potential impact on monetary policy, it is evident that the economic landscape is evolving rapidly.

Market participants and policymakers must remain vigilant and adaptable in the face of dynamic conditions.

The coming months promise to be pivotal as we witness the Federal Reserve’s response to these unforeseen developments and their broader economic implications.


Disclaimer  

Comments, news, research, analysis, price, and all information contained in the article only serve as general information for readers and do not suggest any advice. Ultima Markets has taken reasonable measures to provide up-to-date information, but cannot guarantee accuracy, and may modify without notice. Ultima Markets will not be responsible for any loss incurred due to the application of the information provided.