This website is managed by Ultima Markets’ international entities, and it’s important to emphasise that they are not subject to regulation by the FCA in the UK. Therefore, you must understand that you will not have the FCA’s protection when investing through this website – for example:
You will not be guaranteed Negative Balance Protection
You will not be protected by FCA’s leverage restrictions
You will not have the right to settle disputes via the Financial Ombudsman Service (FOS)
You will not be protected by Financial Services Compensation Scheme (FSCS)
Any monies deposited will not be afforded the protection required under the FCA Client Assets Sourcebook. The level of protection for your funds will be determined by the regulations of the relevant local regulator.
Note: Ultima Markets is currently developing a dedicated website for UK clients and expects to onboard UK clients under FCA regulations in 2026.
If you would like to proceed and visit this website, you acknowledge and confirm the following:
1.The website is owned by Ultima Markets’ international entities and not by Ultima Markets UK Ltd, which is regulated by the FCA.
2.Ultima Markets Limited, or any of the Ultima Markets international entities, are neither based in the UK nor licensed by the FCA.
3.You are accessing the website at your own initiative and have not been solicited by Ultima Markets Limited in any way.
4.Investing through this website does not grant you the protections provided by the FCA.
5.Should you choose to invest through this website or with any of the international Ultima Markets entities, you will be subject to the rules and regulations of the relevant international regulatory authorities, not the FCA.
Ultima Markets wants to make it clear that we are duly licensed and authorised to offer the services and financial derivative products listed on our website. Individuals accessing this website and registering a trading account do so entirely of their own volition and without prior solicitation.
By confirming your decision to proceed with entering the website, you hereby affirm that this decision was solely initiated by you, and no solicitation has been made by any Ultima Markets entity.
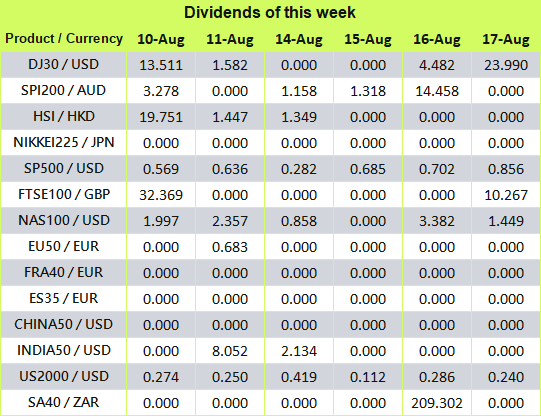
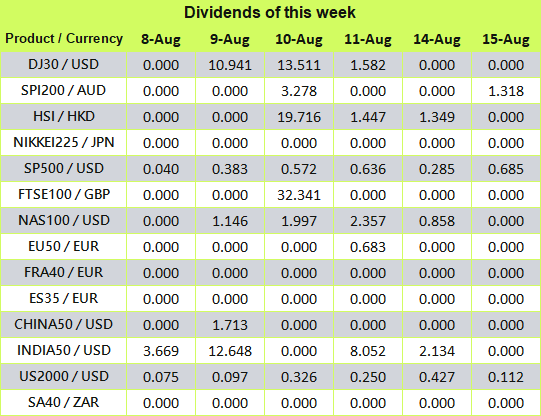
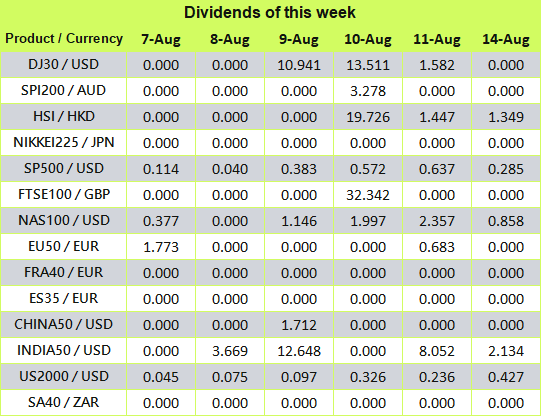
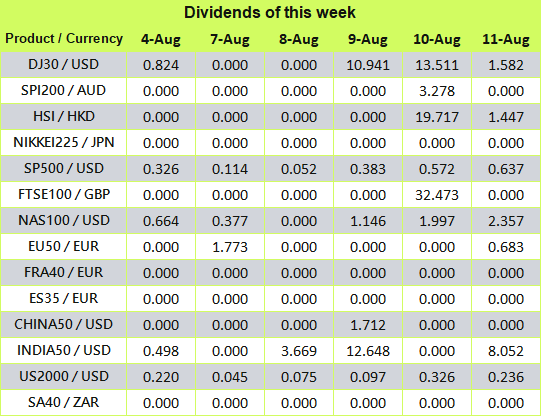
When you are trading in Contracts for Difference (CFDs) on spot stock indices, if a component of the underlying stock index pays a dividend/dividend (payout) to its shareholders, your trading account will be adjusted ex-dividend at 00:00 server time on the same day, and the corresponding gain or expense will occur depending on the position you are holding and will be reflected in the account history.
• The above data are expressed in the base currency of each index.
• According to market practice, the actual execution data may change,
please refer to MT4 software for details.
When the stock index goes ex-dividend, the dividend will be adjusted in the form of fund deduction.
You can view the fund deduction record with the following annotation “Div & stock index name & net lot” in the account history,It is the dividend adjustment. The long lot is calculated as a “positive value”, and the short lot is calculated as a “negative value”. The sum of the two is the “net lot”.
An example is as follows.
If you trade more than 5 lots of DJ30, you can view the “Div & DJ30 & 5” dividend adjustment record in the form of balance in the account history; View the “Div & DJ30 & -5” dividend adjustment records in the form of balance.
We recommend that you carefully evaluate your current positions and consider whether to hold it overnight.
If you have any questions or require assistance, please do not hesitate to contact [email protected]
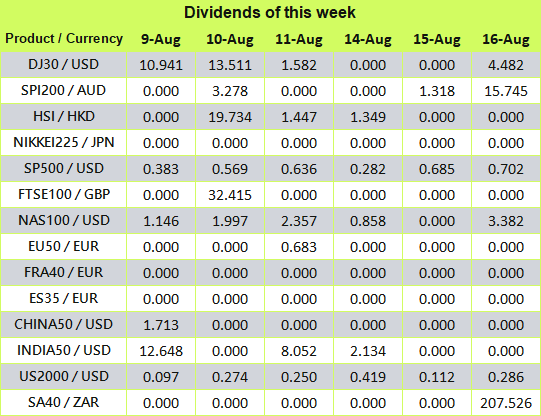
On fundamentals, last week PMI figures in the euro zone reconfirmed the pressure on the European economy, with the manufacturing sector recording 42.7 in July, the lowest manufacturing PMI since 2020. The PMI for the services sector was revised down to 50.9 in July, the lowest up to date. In this context, the market’s expectation for the end of the ECB interest rate hike has fallen from the high of 3.95% in July to the current 3.8%. Investors can wait for the market to digest the interest rate difference between Europe and the United States, and then pay attention to the impact of more economic data on the future.
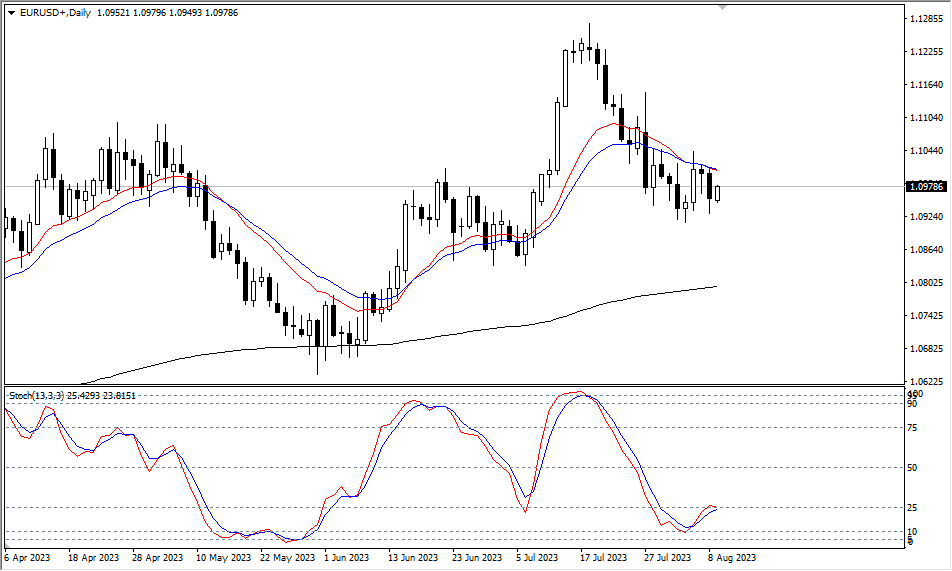
Technically speaking, in EUR/USD daily cycle, the short-term moving averages formed by the 15-day and 21-day suppressed the rise of the exchange rate in the short run. Although it fell below Monday’s low yesterday, there are still bullish opportunities.
(EUR/USD daily cycle, Ultima Markets MT4)
The stochastic oscillator formed a golden cross gesture last week, and there is a bullish potential, but it can only be clarified after the suppression of the short-term moving averages reverses.
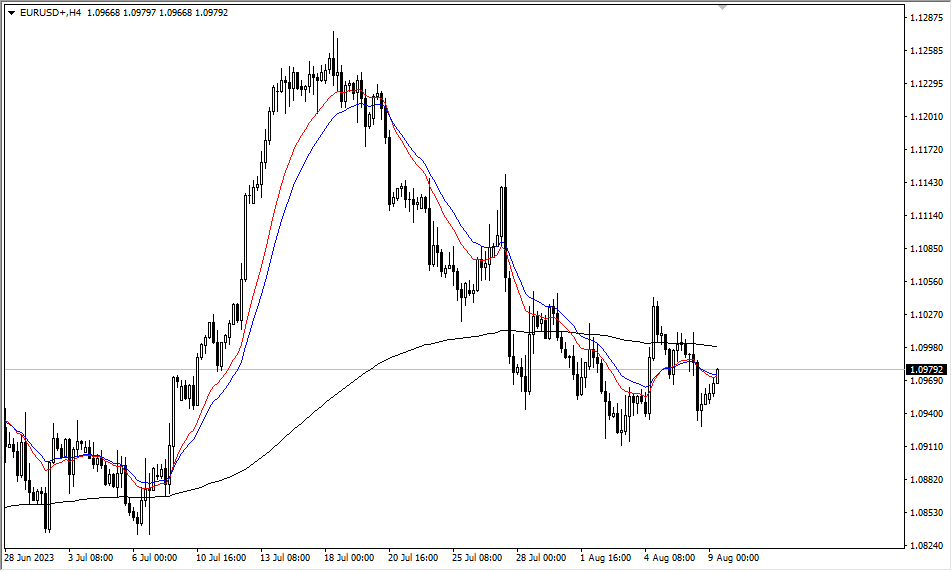
(EUR/USD 4 -hour cycle, Ultima Markets MT4)
In the 4- hour cycle, the exchange rate doesn’t form an effective long structure, and still needs to wait for the confirmation of moving averages and price actions. It is necessary to watch out for any bearish strike in the short term.
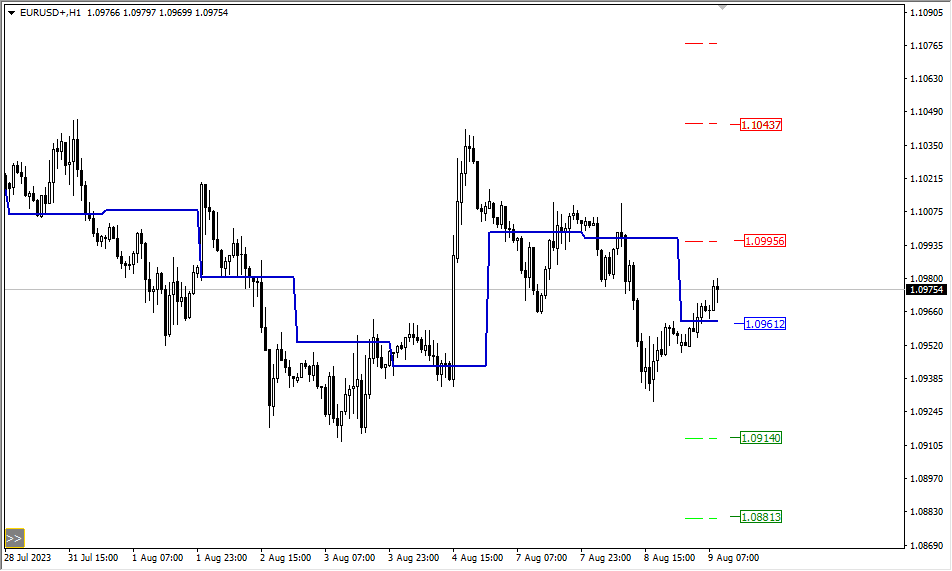
(EUR/USD 1 -hour cycle, Ultima Markets MT4)
According to the pivot indicator, the central price of the day is 1.09612,
Bullish above 1.09612, the first target is 1.09956, and the second target 1.10437.
Bearish below 1.09612, the first target is 1.09140, and the second target 1.08813.
Disclaimer
Comments, news, research, analysis, price, and all information contained in the article only serve as general information for readers and do not suggest any advice. Ultima Markets has taken reasonable measures to provide up-to-date information, but cannot guarantee accuracy, and may modify without notice. Ultima Markets will not be responsible for any loss incurred due to the application of the information provided.
When you are trading in Contracts for Difference (CFDs) on spot stock indices, if a component of the underlying stock index pays a dividend/dividend (payout) to its shareholders, your trading account will be adjusted ex-dividend at 00:00 server time on the same day, and the corresponding gain or expense will occur depending on the position you are holding and will be reflected in the account history.
• The above data are expressed in the base currency of each index.
• According to market practice, the actual execution data may change,
please refer to MT4 software for details.
When the stock index goes ex-dividend, the dividend will be adjusted in the form of fund deduction.
You can view the fund deduction record with the following annotation “Div & stock index name & net lot” in the account history,It is the dividend adjustment. The long lot is calculated as a “positive value”, and the short lot is calculated as a “negative value”. The sum of the two is the “net lot”.
An example is as follows.
If you trade more than 5 lots of DJ30, you can view the “Div & DJ30 & 5” dividend adjustment record in the form of balance in the account history; View the “Div & DJ30 & -5” dividend adjustment records in the form of balance.
We recommend that you carefully evaluate your current positions and consider whether to hold it overnight.
If you have any questions or require assistance, please do not hesitate to contact [email protected]
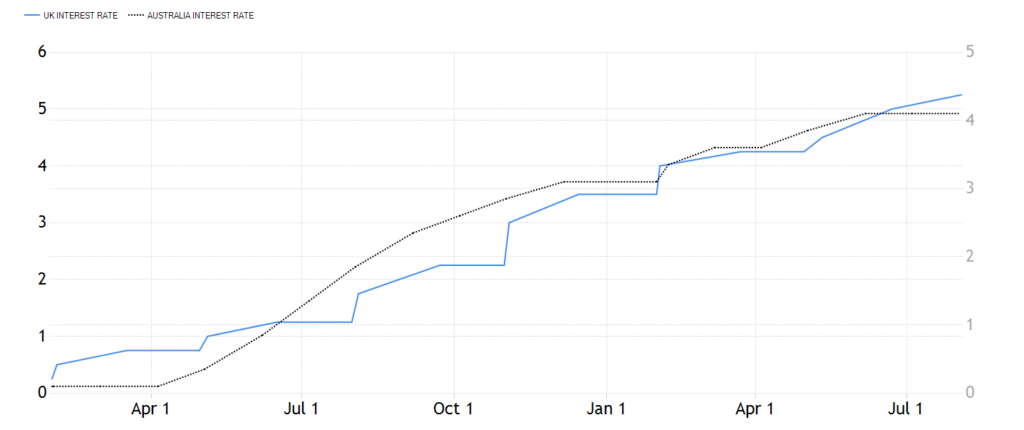
On fundamentals, there is no notable financial data due today. The difference in monetary policy between the UK and Australia will control the currency exchange rate in the short run.
(Blue vs Black, BoE rate vs RBA rate)
The BoE raised its benchmark interest rate by 25 bps to the highest level of 5.25% since 2008. At the same time, the RBA’s is currently set at 4.1%. The interest rate differential means room for arbitrage. AUD is deemed as a commodity currency, inherently vulnerable to commodity prices. The market is positive about RBA rate hikes, resulting in a bullish view of AUD.
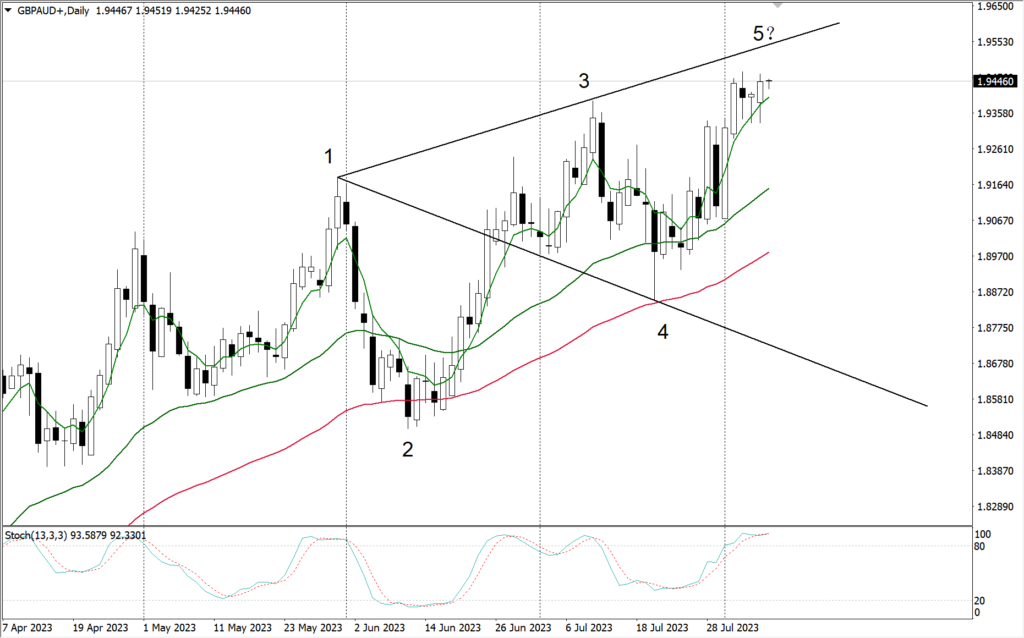
Technically speaking, the GBP/AUD daily cycle structure presents a potential Wolf Wave structure. However, the current price action structure does not show a clear bearish structure.
(GBP/AUD daily cycle, Ultima Markets MT4)
The daily price action has room to rise — support is found on the 33-day moving average. The exchange rate fluctuated on the 5-day moving average for three days and stopped falling with three lower shadows. Still, we need to be alert. The stochastic oscillator has been entangled, and the upper resistance line is not far away. The market may reverse at any time.
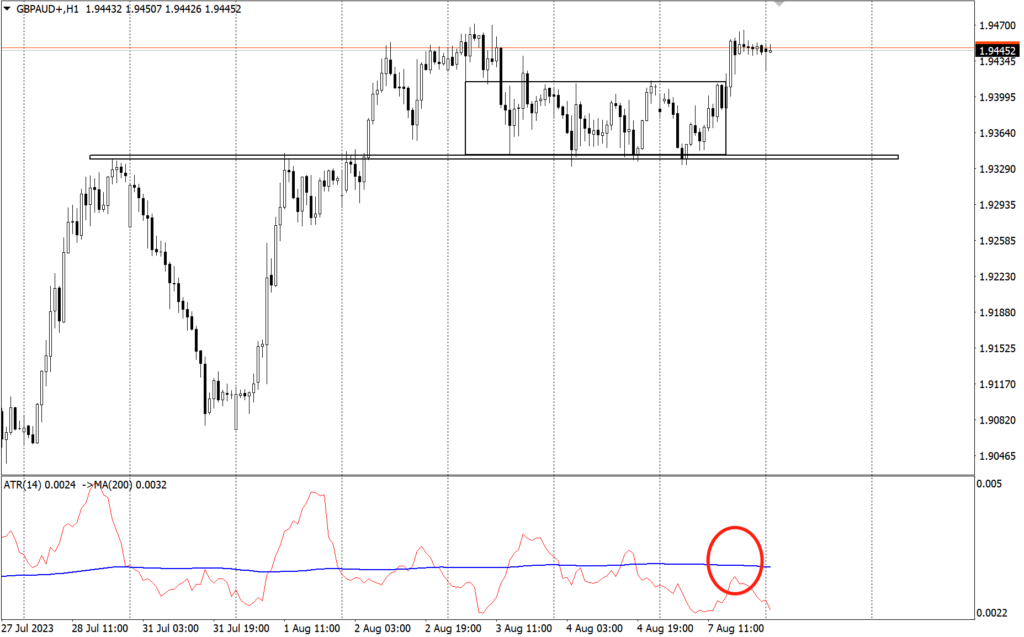
(GBP/AUD 1 -hour cycle, Ultima Markets MT4)
On the hourly chart, GBP/AUD has formed a clear rectangular range after three days of swinging. Yesterday’s breakthrough suggested that bulls are more dominant in the short run. However, judging from the ATR combination indicators, it is doubtful whether the market breakthrough is effective. From a technical standpoint, GBP/AUD looks bullish, however, the sentiment may quickly change.
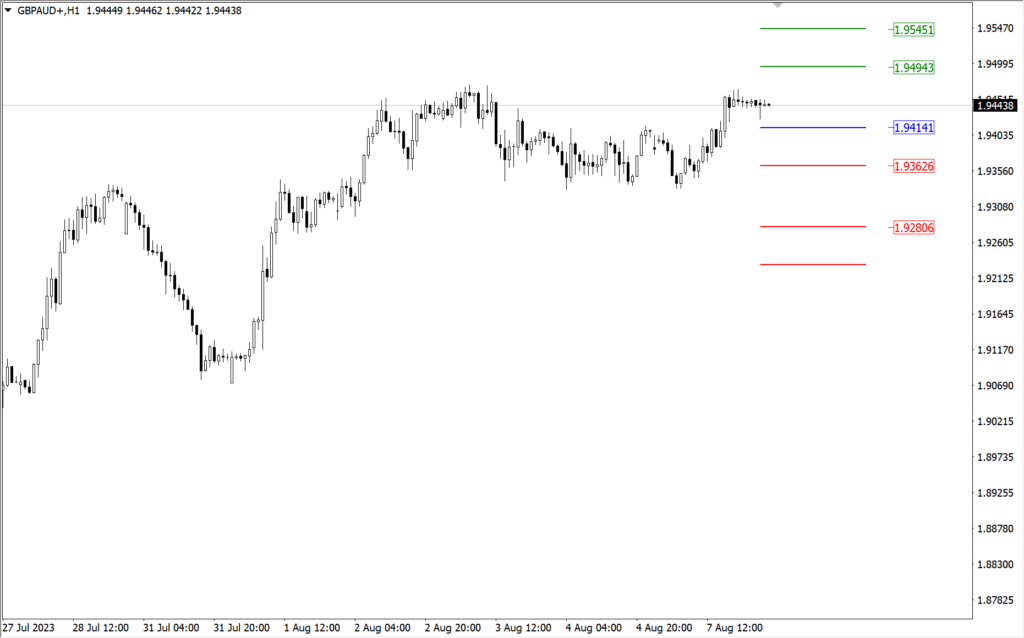
(GBP/AUD 1- hour cycle, Ultima Markets MT4)
According to the pivot indicator in Ultima Markets MT4, the central price of the day is 1.94141,
Bullish above 1.94141, the first target is 1.94943, and the second is 1.95451.
Bearish below 1.94141, the first target is 1.93626, and the second is 1.92806.
Disclaimer
Comments, news, research, analysis, price, and all information contained in the article only serve as general information for readers and do not suggest any advice. Ultima Markets has taken reasonable measures to provide up-to-date information, but cannot guarantee accuracy, and may modify without notice. Ultima Markets will not be responsible for any loss incurred due to the application of the information provided.
Futures contracts switch to new contracts on the expiration date regularly, the process is known as “Rollover.”
Market prices may experience fluctuations caused by non-market factors after the rollover. Positions in futures contracts will undergo corresponding funding adjustments based on the rollover direction to reflect the value change when transitioning between old and new contracts.
Below is the schedule for the futures contract rollover at Ultima Markets in August.
The Rollover Schedule of Futures in Aug
Symbol
Description
Rollover Date
Current Contract
Next Contract
VIX
Volatility
2023/8/11
Aug-23
Sep-23
FRA40ft
France 40 Index Future
2023/8/16
Aug-23
Sep-23
CL-OIL
Crude Oil West Texas Future
2023/8/17
Sep-23
Oct-23
UKOUSDft
Brent Oil Future
2023/8/23
Oct-23
Nov-23
CHINA50ft
CHINA50 Future
2023/8/24
Aug-23
Sep-23
HK50ft
Hong Kong 50 Future
2023/8/25
Aug-23
Sep-23
FLG
UK Long Gilt Futures
2023/8/25
Sep-23
Dec-23
TY
US 10 YR T-Note Futures Decimalised
2023/8/29
Sep-23
Dec-23
Friendly Reminder
• Internal transfers will be suspended during the half-hour before and after the rollover.
• Investors are advised to carefully manage their positions or adjust the take-profit and stop-loss settings before the rollover.
• Liquidity providers might adjust the rollover schedules base on the dynamic nature of market conditions. The up-to-date execution data should be subject to information on the MetaTrader software/application.
If you have any questions or require assistance, please do not hesitate to contact [email protected].
When you are trading in Contracts for Difference (CFDs) on spot stock indices, if a component of the underlying stock index pays a dividend/dividend (payout) to its shareholders, your trading account will be adjusted ex-dividend at 00:00 server time on the same day, and the corresponding gain or expense will occur depending on the position you are holding and will be reflected in the account history.
• The above data are expressed in the base currency of each index.
• According to market practice, the actual execution data may change,
please refer to MT4 software for details.
When the stock index goes ex-dividend, the dividend will be adjusted in the form of fund deduction.
You can view the fund deduction record with the following annotation “Div & stock index name & net lot” in the account history,It is the dividend adjustment. The long lot is calculated as a “positive value”, and the short lot is calculated as a “negative value”. The sum of the two is the “net lot”.
An example is as follows.
If you trade more than 5 lots of DJ30, you can view the “Div & DJ30 & 5” dividend adjustment record in the form of balance in the account history; View the “Div & DJ30 & -5” dividend adjustment records in the form of balance.
We recommend that you carefully evaluate your current positions and consider whether to hold it overnight.
If you have any questions or require assistance, please do not hesitate to contact [email protected]
The non-farm payrolls have passed, the inflation data has come, and the dollar is still in decline
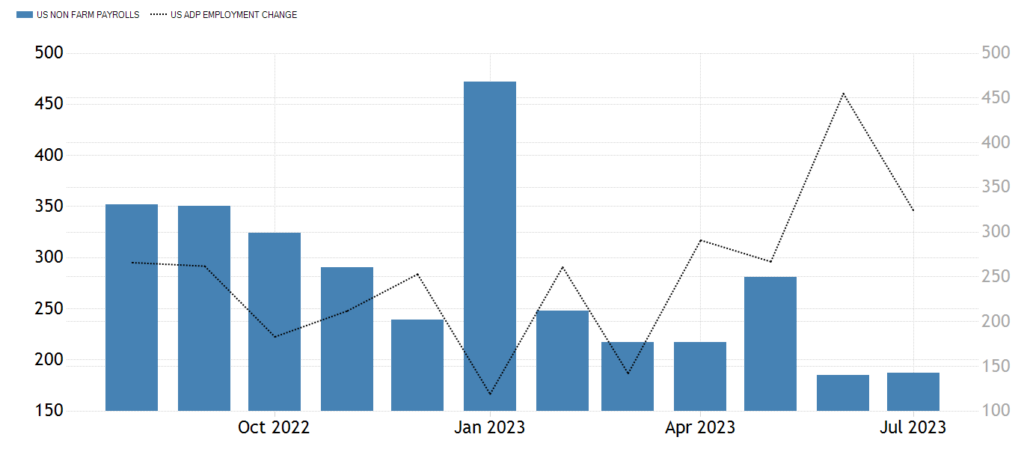
Last Friday, August 4th, the U.S. nonfarm payrolls data fell short of expectations for the second consecutive month. According to the data released by the U.S. Department of Labor, the seasonally adjusted non-agricultural employment in the United States increased by 187,000 in July, the lowest number of new jobs since December 2020, compared with market expectations of 200,000.
Nonfarm Payrolls: A Disappointing Trend
Previously, new job figures for May and June were revised down as well. The May’s number was revised down from 339,000 to 306,000 and the June’s down to 185,000.
It is worth noting that ADP, the identical twin of non-agricultural employment data, also showed a downward trend in August, and this time it did not show the opposite trend to the nonfarm payrolls data.
The divergence in the first two months made the reference value of ADP to decrease.
(Blue column vs black line; non-farm payrolls vs ADP)
Unemployment Rate and Hourly Wages
On the other hand, the unemployment rate eased to 3.5% from 3.6 % in June. In addition, the hourly wage continued to record steady growth in July, increasing by 4.4% year-on-year, beating expectations of 4.2%. The increase in hourly wages may not be what the FED wants to see because of its 2% inflation target.
FED’s Role in the Labor Market
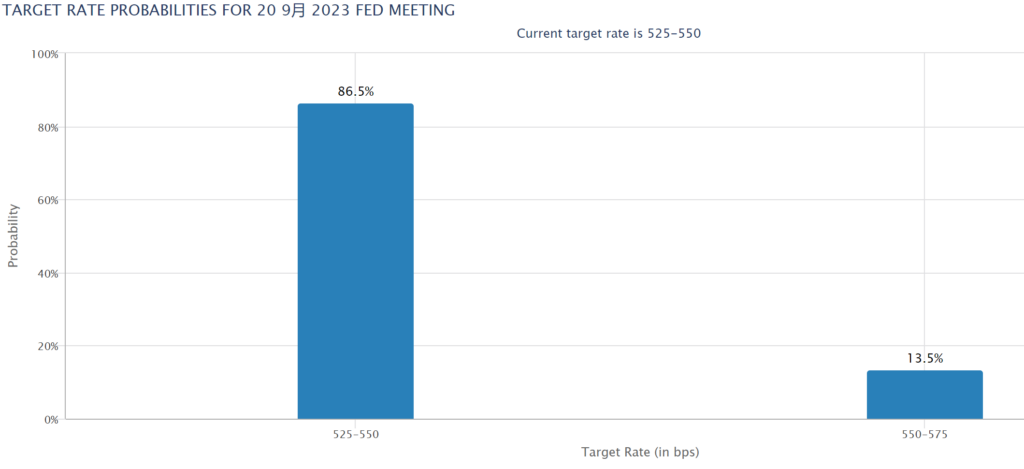
Elon, analyst at Ultima Markets Investment Research Group, said “In general, the FED’s continued tightening policy has begun to take effect in the labor market, and the decline in the number of new jobs for two consecutive months represents the beginning of cooling job market. As a result, the consensus for rate hike in September has not changed significantly.
(The chance that the Fed will not raise interest rates stays at nearly 90%, sourced from the Fed Interest Rate Observation Tool)
Impact on Gold and Non-U.S. Currencies
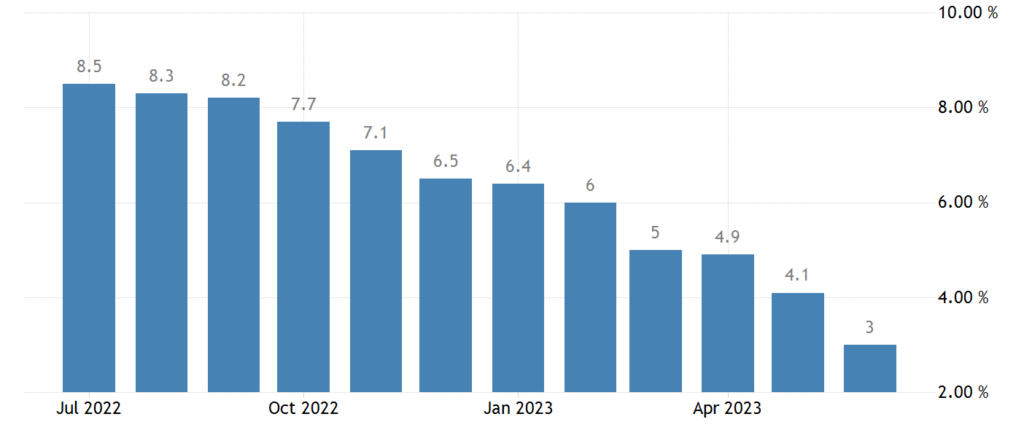
Gold and non-US currencies altogether is happy with the expectation of the Fed’s move to leave interest rates unchanged. It is important to watch out for inflation data this week. Last month, the inflation rate returned to 3%. If the inflation continues cooling, the dollar will go downwards again.
(CPI rates in one year)
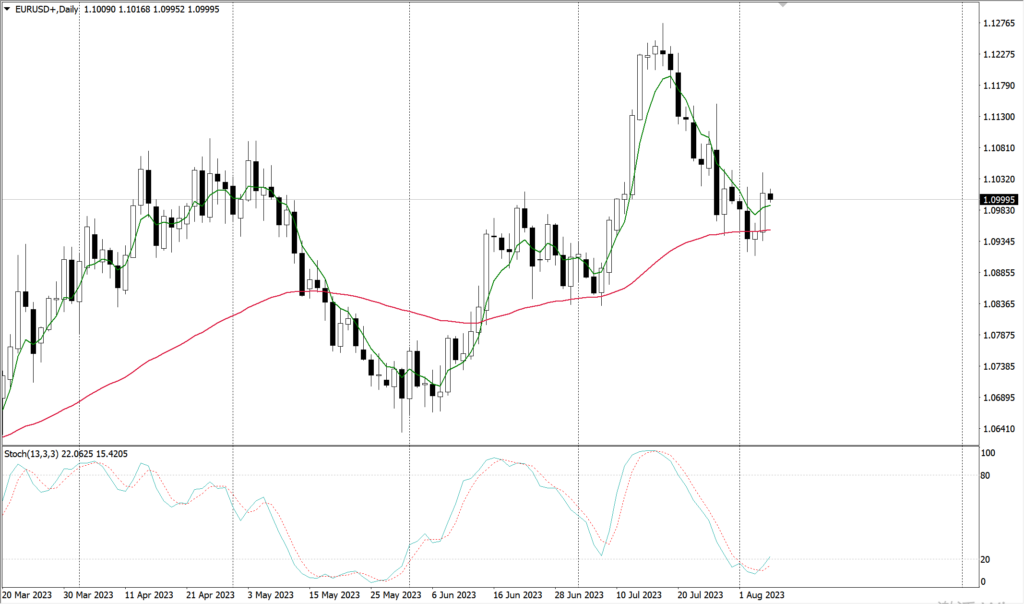
Technical Analysis of the Euro
Technically, the euro finds its support on the back of 1.09, rising above the 65-day moving average and the 5-day moving average again. The Stochastic Oscillator is also showing a golden cross gesture, suggesting an underlying bullish trend. If the euro breaks through the peak last week, it will expectedly resume an uptrend.
(Daily chart of EUR/USD, Ultima Markets MT4)
Disclaimer
Comments, news, research, analysis, price, and all information contained in the article only serve as general information for readers and do not suggest any advice. Ultima Markets has taken reasonable measures to provide up-to-date information, but cannot guarantee accuracy, and may modify without notice. Ultima Markets will not be responsible for any loss incurred due to the application of the information provided.
When you are trading in Contracts for Difference (CFDs) on spot stock indices, if a component of the underlying stock index pays a dividend/dividend (payout) to its shareholders, your trading account will be adjusted ex-dividend at 00:00 server time on the same day, and the corresponding gain or expense will occur depending on the position you are holding and will be reflected in the account history.
• The above data are expressed in the base currency of each index.
• According to market practice, the actual execution data may change,
please refer to MT4 software for details.
When the stock index goes ex-dividend, the dividend will be adjusted in the form of fund deduction.
You can view the fund deduction record with the following annotation “Div & stock index name & net lot” in the account history,It is the dividend adjustment. The long lot is calculated as a “positive value”, and the short lot is calculated as a “negative value”. The sum of the two is the “net lot”.
An example is as follows.
If you trade more than 5 lots of DJ30, you can view the “Div & DJ30 & 5” dividend adjustment record in the form of balance in the account history; View the “Div & DJ30 & -5” dividend adjustment records in the form of balance.
We recommend that you carefully evaluate your current positions and consider whether to hold it overnight.
If you have any questions or require assistance, please do not hesitate to contact [email protected]
On Fundamentals, BoE raised its benchmark interest rate by 25 bps yesterday, reaching the highest level since 2008. Rising interest rates mean higher borrowing costs, meaning more pressure on many homeowners. The UK continues to be on the edge of recession. Separately, RBA’s monetary report suggests suspending interest rate hikes, however, leaves room for another 15-bps raise.
BoE’s monetary policy was significantly more hawkish than RBA’s, resulting in an appreciation of GBP/AUD since February 2023. However, BoE’s policy no longer brought bullish sentiment on the pound but worries on the British outlook. At present , the market is certian on the future peak interest rate of the RBA, which will lead to a potential bullishness on the Australian dollar .
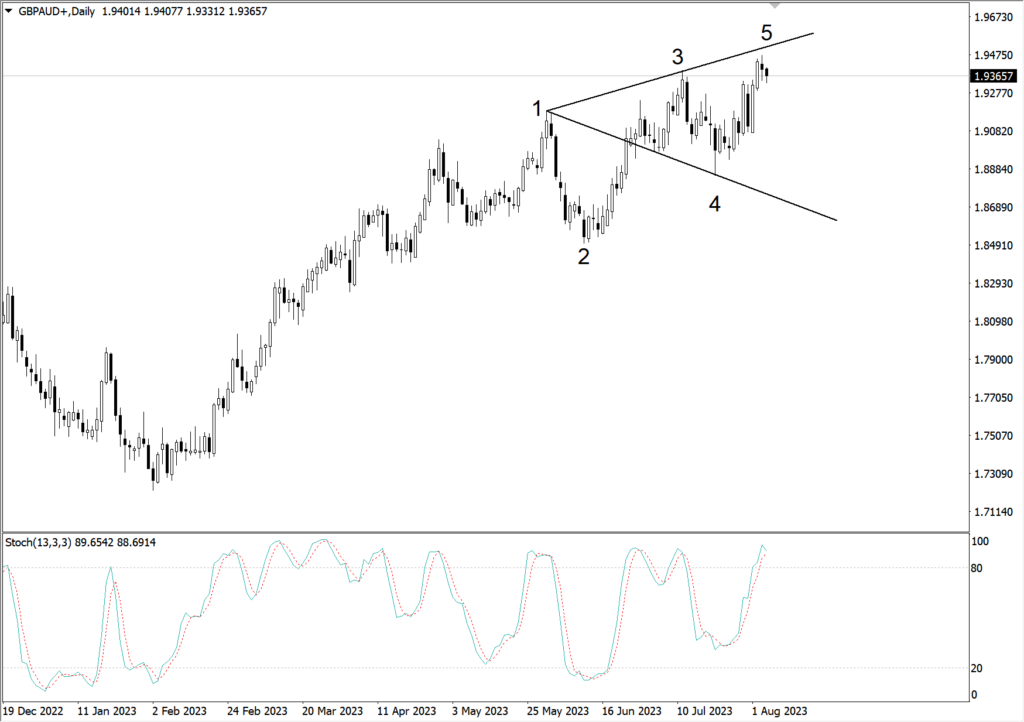
Technically speaking, the GBP/AUD daily cycle presents a potential Wolf Wave structure, but the price action structure does not display a clear bearish signal at moment.
(GBP/AUD daily cycle, Ultima Markets MT4)
The Stochastic Oscillator shows no dead cross on the daily cycle. Please be aware of GBP/JPY’s next bullish trend.
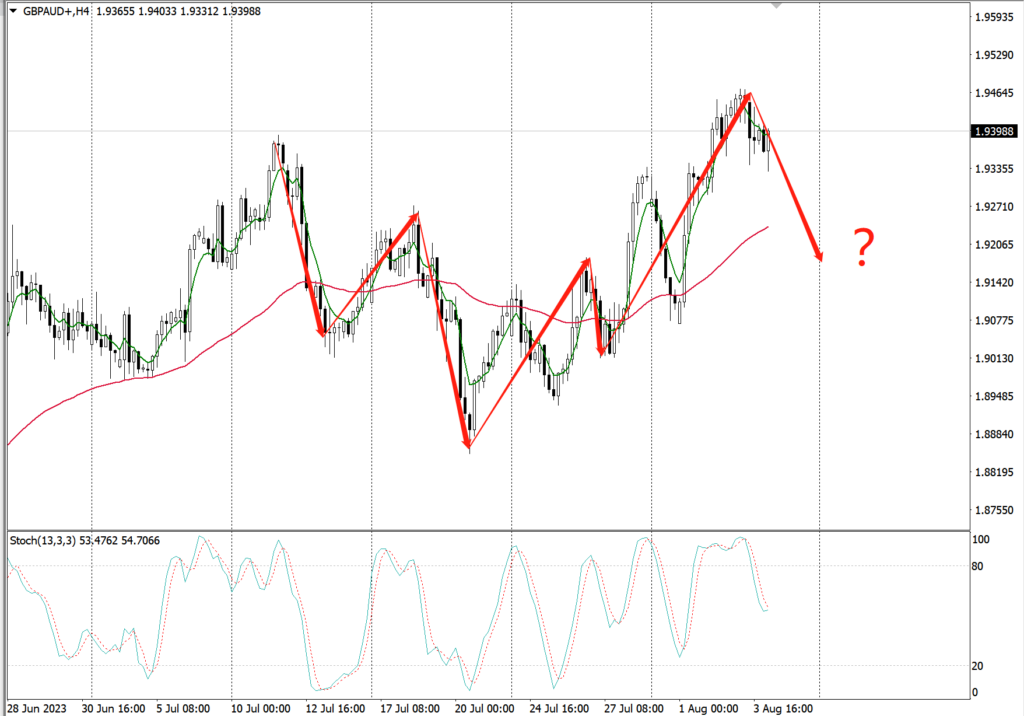
(4-hour GBP/AUD cycle, Ultima Markets MT4 )
The 4-hour Elliott Wave structure of GBP/AUD suggests that it may be in a double-saw-tooth rebound phase. After the market confirms the bearish trend, it is possible to pave a sharp downward path.
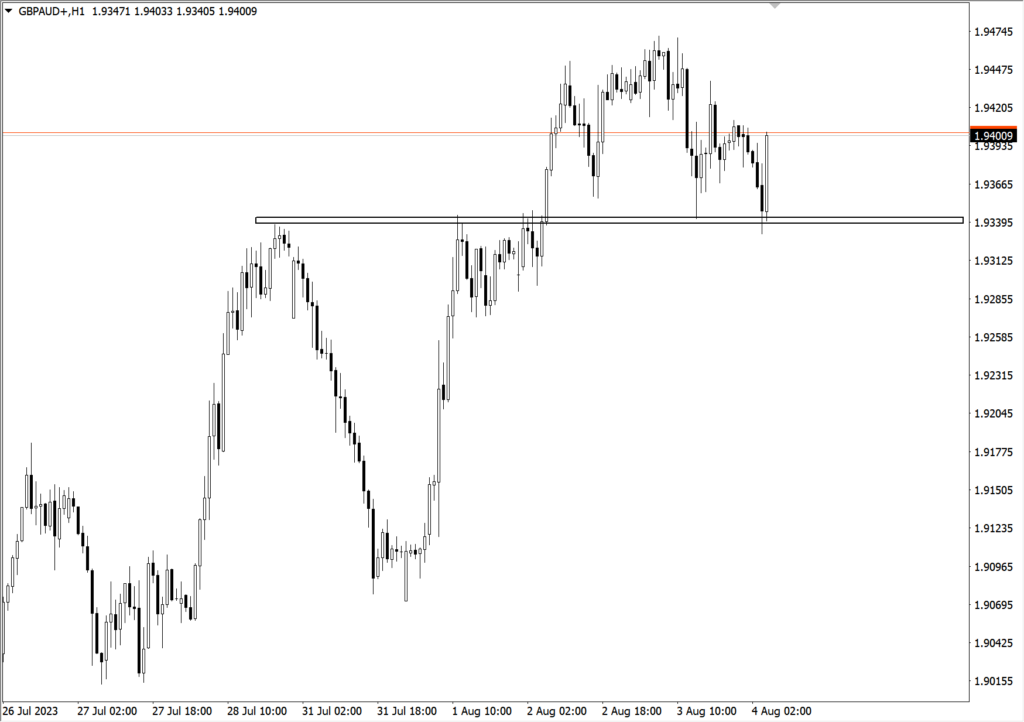
(1-hour GBP/AUD cycle, Ultima Markets MT4)
On 1-hour cycle of GBP/AUD, a turning point emerged. The exchange rate fell rapidly and was close to the previous breakthrough price. On August 2, the price action formed a potential head-and-shoulders structure. If it falls below the 1.9338 neckline, the probability of going bearish will increase.
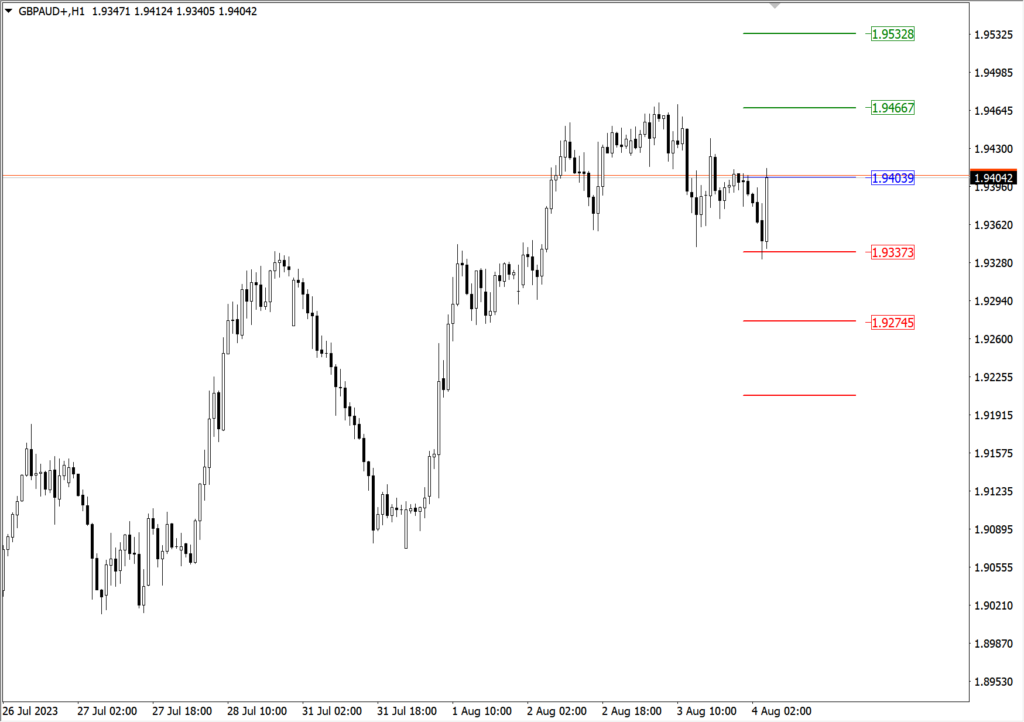
(1- hour GBP/AUD cycle, Ultima Markets MT4)
According to the pivot indicator in Ultima Markets MT4 , the central price of the day is 1.94039 ,
Bullish above 1.94039, the first target is 1.94667, and the second is 1.95328.
Bearish below 1.94039, the first target is 1.93373, and the second is 1.92745.
Disclaimer
Comments, news, research, analysis, price, and all information contained in the article only serve as general information for readers and do not suggest any advice. Ultima Markets has taken reasonable measures to provide up-to-date information, but cannot guarantee accuracy, and may modify without notice. Ultima Markets will not be responsible for any loss incurred due to the application of the information provided.