Important Information

You are visiting the website that is operated by Ultima Markets Ltd, a licensed investment firm by the Financial Services Commission “FSC” of Mauritius, under license number GB 23201593. Please be advised that Ultima Markets Ltd does not have legal entities in the European Union.

If you wish to open an account in an EU investment firm and protected by EU laws, you will be redirected to Ultima Markets Cyprus Ltd (the “CIF”), a Cyprus investment firm duly licensed and regulated by the Cyprus Securities and Exchange Commission with license number 426/23.

Germany’s Manufacturing Unexpectedly Rose, Overall Business and Labor Conditions Fell Behind 

Better-than-expected Manufacturing PMI Recorded for Germany  

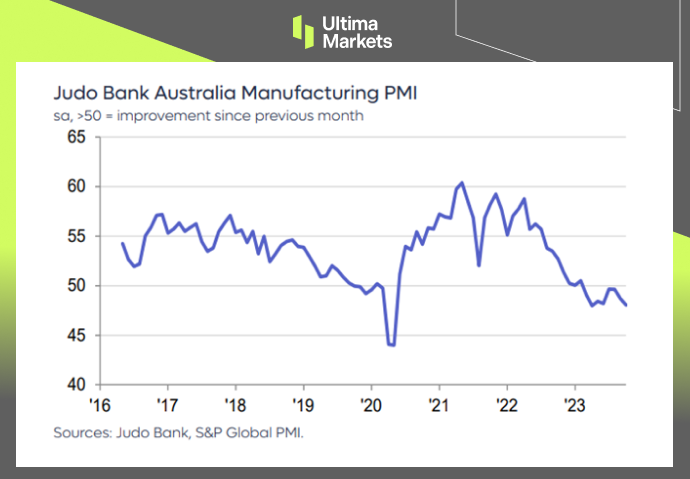
In October 2023, the HCOB Flash Germany Manufacturing PMI registered a 5-month high of 40.7, surpassing the previous record of 39.6 in September and exceeding expectations of 40.  

Although manufacturing new orders showed substantial losses, it displayed signs of easing and reached its lowest level since June. At the same time, the rate at which companies were reducing their workforce was the fastest since October 2020. On the pricing front, factory gate charges continued their downward trend for the fifth consecutive month, although the rate of decline slowed compared to previous months. On the flip side, manufacturers continued to face significant drops in the costs of purchasing materials. Lastly, it’s worth noting that manufacturers still held pessimistic expectations for the future. 

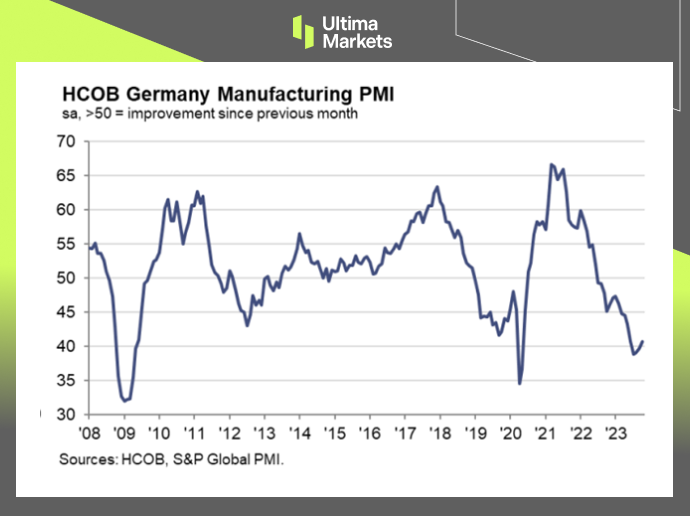
(HCOB Flash Germany Manufacturing PMI,S&P Global) 

German Composite PMI Displaying Lukewarm Business Activities  

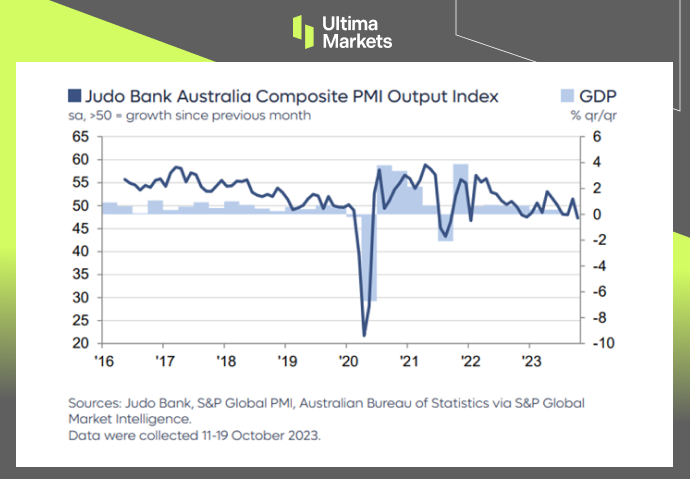
According to an initial estimate, the HCOB Germany Composite PMI fell to 45.8 in October 2023, lower than September’s 46.4 and below the market’s expected 46.7. This indicates a decline in overall economic activity. The service sector, which had shown a slight improvement the previous month, returned to contraction, while manufacturing output continued to decrease. The inflow of new business experienced the sharpest decline since May 2020, and backlogs of work decreased again. 

In addition, there was a rise in unemployment compared to September when workforce numbers had declined for the first time in nearly 3 years. In terms of prices, the rate of inflation for output charges remained relatively stable in October, following a low point in September. Finally, businesses maintained a low level of confidence in the outlook for the year ahead.  

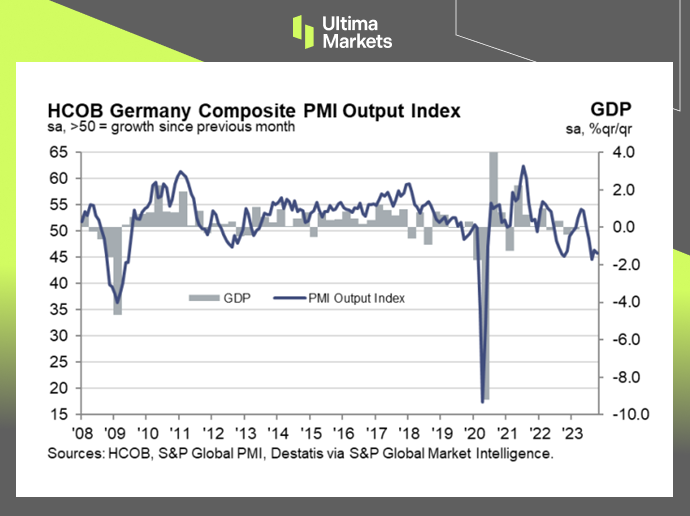
(HCOB Flash Germany Composite PMI Output Index,S&P Global) 

Disclaimer  

Comments, news, research, analysis, price, and all information contained in the article only serve as general information for readers and do not suggest any advice. Ultima Markets has taken reasonable measures to provide up-to-date information, but cannot guarantee accuracy, and may modify without notice. Ultima Markets will not be responsible for any loss incurred due to the application of the information provided. 

Focus on USDCAD today – 25th October 2023 

In this comprehensive analysis, Ultima Markets brings you an insightful breakdown of the USDCAD for 25th October 2023. 

Key Takeaways 

  • BOC is to maintain interest rate : The weak Canadian retail sales data suggests that Canada’s tightening monetary policy has shown results. The Bank of Canada will most likely keep overnight interest rates unchanged at 5.00% tonight. 
  • BOC even has pressure to cut interest rates: Canada’s GDP in the third quarter grew at an annual rate of only 0.2%, far lower than the 1.5% growth predicted by the Bank of Canada. The Bank of Canada will cut interest rates to ease the economic downturn in the future. The market expects the overnight rate to drop to 4.75% or lower by the end of the second quarter of 2024. 
  • Pay attention to the forward guidance: The Bank of Canada’s interest rate path for the year has basically been clear. Focus on the Bank of Canada’s forecast of the economy and interest rate levels in 2024. If it shows a hawkish attitude, be wary of the appreciation trend of the Canadian dollar tonight.  
  • Oil prices drive the depreciation of the Canadian dollar: The price of crude oil fell rapidly after risk aversion gradually subsided, and the Canadian dollar was under pressure to depreciate. If oil prices continue to decline, the USD/CAD may continue to rise.     

Technical Analysis 

Daily Chart Insights 

  • Stochastic Oscillator: Although the fast line once again exceeded the slow line yesterday, the indicator has been relatively volatile since mid-October. The current upward trend is more like an adjustment trend, and it needs to wait for the exchange rate to break through the key price level to be confirmed. 
  • Price Action: The three consecutive candle bars starting on October 5 are a clear downward trend. Therefore, even if the market is rising in the short term, as long as it does not break through the high point of the pin bar on October 5, it cannot be considered as the arrival of bulls. 

4-hour Chart Analysis 

  • Wolfe wave pattern: The upward trend since October 10 has been relatively volatile, and the market trend currently forms a typical Wolfe wave pattern. Wait for point 5 to touch the upper extension line, then the market price will most likely form a short trend. 
  • Elliot Wave Theory: The rapid decline since October 5 is a downward driving wave with a 5-wave structure. The rise since October 10 is temporarily determined to be a corrective wave. Only when the market price breaks through 1.37851, can it be confirmed that the downward driving wave is incorrect. 
  • Fibonacci retracement: The market price broke through the 78.6% retracement of the downward trend, and there was a pullback during the US trading session yesterday. There is a certain probability that the exchange rate will rise. If a clear bearish candlestick pattern appears, the market may move lower quickly.

Pivot Indicator 

  • According to the pivot indicator in Ultima Markets MT4, the central price of the day is established at 1.37193, 
  • Bullish Scenario: Bullish sentiment prevails above 1.37193, first target 1.37765, second target 1.38129; 
  • Bearish Outlook: In a bearish scenario below  1.37193, first target 1.36833, second target 1.36255. 

Conclusion 

To navigate the complex world of trading successfully, it’s imperative to stay informed and make data-driven decisions. Ultima Markets remains dedicated to providing you with valuable insights to empower your financial journey. 

For personalized guidance tailored to your specific financial situation, please do not hesitate to contact Ultima Markets. 

Join Ultima Markets today and access a comprehensive trading ecosystem equipped with the tools and knowledge needed to thrive in the financial markets. 

Stay tuned for more updates and analyses from our team of experts at Ultima Markets. 

Legal Documents 

Ultima Markets, a trading name of Ultima Markets Ltd, is authorized and regulated by the Financial Services Commission “FSC” of Mauritius as an Investment Dealer (Full-Service Dealer, excluding Underwriting) (license No. GB 23201593). The registered office address: 2nd Floor, The Catalyst, 40 Silicon Avenue, Ebene Cybercity, 72201, Mauritius. 

Copyright © 2023 Ultima Markets Ltd. All rights reserved. 

Disclaimer   

Comments, news, research, analysis, price, and all information contained in the article only serve as general information for readers and do not suggest any advice. Ultima Markets has taken reasonable measures to provide up-to-date information, but cannot guarantee accuracy, and may modify without notice. Ultima Markets will not be responsible for any loss incurred due to the application of the information provided.

Ultima Markets Index Dividend Adjustment Notice

When you are trading in Contracts for Difference (CFDs) on spot stock indices, if a component of the underlying stock index pays a dividend/dividend (payout) to its shareholders, your trading account will be adjusted ex-dividend at 00:00 server time on the same day, and the corresponding gain or expense will occur depending on the position you are holding and will be reflected in the account history.

• The above data are expressed in the base currency of each index.

• According to market practice, the actual execution data may change, please refer to MT4 software for details.

When the stock index goes ex-dividend, the dividend will be adjusted in the form of fund deduction.

You can view the fund deduction record with the following annotation “Div & stock index name & net lot” in the account history,It is the dividend adjustment. The long lot is calculated as a “positive value”, and the short lot is calculated as a “negative value”. The sum of the two is the “net lot”.

An example is as follows.

If you trade more than 5 lots of DJ30, you can view the “Div & DJ30 & 5” dividend adjustment record in the form of balance in the account history; View the “Div & DJ30 & -5” dividend adjustment records in the form of balance.

We recommend that you carefully evaluate your current positions and consider whether to hold it overnight.

If you have any questions or require assistance, please do not hesitate to contact [email protected]

Employment Stays Viable as Australia’s Manufacturing Sector Remains Sluggish  

Manufacturing PMI Hit Lowest Level in Six Months 

The Judo Bank Flash Australia Manufacturing PMI experienced a decline to 48 during the month of October 2023, down from 48.7 in the preceding month, according to preliminary data. This marks the eighth consecutive monthly decline in business conditions and represents the lowest reading in 6 months, primarily attributed to decreased production and diminished new order volumes in response to weakened demand. Input expenses witnessed a notable surge, driven by mounting inflationary pressures reaching a peak not seen in 7 months. Escalating fuel expenses emerged as one of the principal factors contributing to the upward pricing pressure. Although output charges also rose, the pace of increase was comparatively slower. Given the deteriorating market conditions, business sentiment declined to its lowest level in three and a half years. Encouragingly, employment levels sustained growth, thereby extending the ongoing streak of job creation for a duration of 3 years. 

(Judo Bank Australia Manufacturing PMI,S&P Global) 

Composite PMI in Contractionary Shadow 

The Judo Bank Flash Australia Composite PMI dropped to 47.3 during October 2023, plunging from 51.5 in the preceding month, as per preliminary findings. This figure represents the lowest reading observed over a span of 21 months, driven by a substantial decline in operational performance across Australia’s private sector. The downturn in business activity stemmed from a reduction in incoming orders, an unfavorable demand climate, mounting inflationary pressures, and elevated interest rates. The volume of new export business experienced a decline for the eighth consecutive month. Input costs continued their rapid advancement, stimulated by rising inflation that reached a 3-month high. Output prices exhibited an increase as well, albeit weakened customer demand exerted pressure on pricing capabilities, resulting in the slowest pace of charge inflation since March 2021.  

(The Judo Bank Flash Australia Composite PMI,S&P Global) 


Focus on GBP/USD Today – 24th October 2023 


Comprehensive GBP/USD for October 24, 2023

In this comprehensive analysis, Ultima Markets brings you an insightful breakdown of the GBP/USD for 20th October 2023. 


Key Takeaways 

  • Unemployment rate is the key: The British unemployment rate rose slightly in August, which means that the labor market continues to cool down, reducing inflation to a certain extent. If the unemployment rate continues to rise today, the pound may weaken and fall. 
  • Economic pressure in the UK: UK PMI data for October will be released this afternoon, which has always been below the 50 boom-bust line in the early stage. Last week’s UK retail sales data and inflation report both showed that economic activity is weakening, and today’s data may still be in the contraction range. 

GBP/USD Technical Analysis 

GBP/USD Daily Chart Insights

GBP/USD Daily Chart Insights By Ultima Markets MT4
  • Stochastic Oscillator: The indicator completed the “golden cross” structure again yesterday, and there is a certain probability that the short-term market will continue to rise. 
  • Price Action: Last week the bar came out of a bottom structure. In conjunction with the sharp rise yesterday, the bar has formed an evening star combination structure. The market has a probability of continuing to rise. 
  • Moving average resistance: The current exchange rate is below the 33-day moving average (black line). At the same time, the overall market price and short-term moving average are also below the 200-day moving average (dashed line). Even if it is now experiencing a short-term rise, it cannot be premature to conclude that the reversal of the pound is coming. 

GBP/USD 1-hour Chart Analysis

GBP/USD 1-hour Chart Analysis by Ultima Markets MT4
  • Stochastic oscillator: The indicator is entangled in the overbought area. Currently, bulls in the market have the upper hand, and there is some correction pressure on the short-term exchange rate. 
  • Price action: In the end, the market price broke through the previous lowering highs, the overall downward structure was destroyed, and the intraday market ushered in a reversal. If you want to enter the market with the trend, you need to wait for the retracement structure to appear. 
  • Elliot wave structure: After the market price quickly broke through the upward channel line yesterday, it can be temporarily judged that driving wave 3 is underway. The support position is the upper edge of the upward channel. After the market falls back, you can look for trading opportunities. 

Ultima Markets MT4 Pivot Indicator 

Ultima Markets MT4 Pivot Indicator for GBP/USD
  • According to the pivot indicator in Ultima Markets MT4, the central price of the day is established at 1.22157, 
  • Bullish Scenario: Bullish sentiment prevails above 1.22157, first target 1.22890, second target 1.23315; 
  • Bearish Outlook: In a bearish scenario below  1.22157, first target 1.21739, second target 1.21013. 

Conclusion 


Ultima Markets Index Dividend Adjustment Notice

When you are trading in Contracts for Difference (CFDs) on spot stock indices, if a component of the underlying stock index pays a dividend/dividend (payout) to its shareholders, your trading account will be adjusted ex-dividend at 00:00 server time on the same day, and the corresponding gain or expense will occur depending on the position you are holding and will be reflected in the account history.

• The above data are expressed in the base currency of each index.

• According to market practice, the actual execution data may change, please refer to MT4 software for details.

When the stock index goes ex-dividend, the dividend will be adjusted in the form of fund deduction.

You can view the fund deduction record with the following annotation “Div & stock index name & net lot” in the account history,It is the dividend adjustment. The long lot is calculated as a “positive value”, and the short lot is calculated as a “negative value”. The sum of the two is the “net lot”.

An example is as follows.

If you trade more than 5 lots of DJ30, you can view the “Div & DJ30 & 5” dividend adjustment record in the form of balance in the account history; View the “Div & DJ30 & -5” dividend adjustment records in the form of balance.

We recommend that you carefully evaluate your current positions and consider whether to hold it overnight.

If you have any questions or require assistance, please do not hesitate to contact [email protected]

Oil Markets Surge Amidst Geopolitical Uncertainty

Geopolitical Turmoil Fuels Oil Price Surge

Amidst the volatile landscape of the global oil market, October 2023 stands out as a month of upheaval and uncertainty, with crude oil prices surging to a noteworthy $90 per barrel.

This escalation can be attributed to escalating geopolitical tensions, notably the intensifying conflicts between Israel and Gaza, which has far-reaching implications for the world’s energy sector.

Crude Prices Rushed to US$90 on Escalating Tensions in Middle East   

Escalating turmoil between Israel and Gaza ramped up concerns of supply disruptions among key producers in the Middle East. Additionally, U.S. military forces in Iraq were targeted in two separate drone attacks further intensifying market sentiment. Both WIT and Brent have emerged at the $90 per barrel mark, a significant technical threshold.  

Brent Crude One-year Chart By Ultima Markets MT4

(Brent Crude One-year Chart) 

WIT Crude One-year Chart By Ultima Markets MT4

(WIT Crude One-year Chart) 


Sharp Decrease in Global Oil Reserves 

According to the latest International Energy Agency (IEA) report, in August, there was a significant decline in global oil inventories, with a decrease of 63.9 million barrels (mb) observed.

This drop was primarily driven by a massive drawdown of 102.3 mb in crude oil stocks. Initial data indicates that inventories on land continued to decrease in September, but there was a rebound in oil stored on water as exports started to recover.


Inventory Trends

In the OECD countries, industry stocks experienced an unusual decline of 6.5 mb in August, reaching a total of 2,816 mb, which is substantially lower by 105.3 mb compared to the five-year average. 


Conclusion

In conclusion, the surge in crude oil prices to $90 per barrel in October 2023 can be primarily attributed to escalating geopolitical uncertainty, particularly in the Middle East.

The tensions between Israel and Gaza, coupled with drone attacks on U.S. military forces in Iraq, have heightened concerns about potential disruptions in the global oil supply chain.

As a result, the energy industry and financial markets are navigating a period of uncertainty, emphasizing the interconnectedness of geopolitics and global energy markets.

We will continue to watch these developments closely, as they have the potential to reshape the oil market landscape in the coming months.


Focus on GBP/USD Today – 20th October 2023 


Comprehensive GBP/USD for October 20, 2023

In this comprehensive analysis, Ultima Markets brings you an insightful breakdown of the GBP/USD for 20th October 2023. 


Key Takeaways 

  • High Inflation low hike expectations: Although Wednesday’s CPI data was stronger than expected, considering that CPI is still lower than the central bank’s August forecast of 6.9%, the monthly price level still maintains a downward trend. Therefore, the Bank of England may continue to maintain the current high interest rates for some time. 
  • Powell disturbed the market: In the early morning, Federal Reserve Chairman Powell gave a speech that if he saw further signs of strong economic growth, he might raise interest rates again. This statement shocked the market. 
  • Lack of long-term economic momentum in the UK: The UK faces high public debt, a possible recession, rising energy prices and the upcoming general election, all of which may limit economic growth and hit the pound. 

GBP/USD Technical Analysis 

GBP/USD Daily Chart Insights

GBP/USD Daily Chart Insights By Ultima Markets MT4
  • Stochastic Oscillator: The indicator fell below the midline yesterday, and there is a possibility that the market will decline further. 
  • Price Action: The bar closed as a doji bar yesterday, indicating the current balance of long and short forces. The market today is bound to be a big fluctuation market – either it will accelerate the decline, or it will rise sharply. 

GBP/USD 4-hour Chart Analysis

GBP/USD 4-hour Chart Analysis By Ultima Markets MT4
  • Fibonacci price: Yesterday, the exchange rate rose rapidly after falling to the 78.6% retracement price of the previous upward trend line. It is currently blocked by the 33-period and 65-period moving averages. If the 78.6% retracement level still fails to prevent the market from falling, the exchange rate may look towards the 1.2036. 
  • Stochastic Oscillator: The indicator has formed a golden cross yesterday and is currently blocked at the 50 midline. This means that short-term bulls are exhausted, and transactions still need to wait for the breakthrough of the midline before confirmation. 
  • Price Action: The market has rebounded four times in a row, and each rebound cannot exceed the previous one. The continuous lowering of high price means that the short force always has the upper hand. If the market wants to reverse, it needs to destroy the current structure, that is, break through the previous rebound high of 1.2190. 

Ultima Markets MT4 Pivot Indicator

Ultima Markets MT4 Pivot Indicator got GBP/USD
  • According to the pivot indicator in Ultima Markets MT4, the central price of the day is established at 1.21427, 
  • Bullish Scenario: Bullish sentiment prevails above1.21427, first target 1.21933, second target 1.22434; 
  • Bearish Outlook: In a bearish scenario below  1.21427, first target 1.20921, second target 1.20402. 

Conclusion 


Ultima Markets Index Dividend Adjustment Notice

When you are trading in Contracts for Difference (CFDs) on spot stock indices, if a component of the underlying stock index pays a dividend/dividend (payout) to its shareholders, your trading account will be adjusted ex-dividend at 00:00 server time on the same day, and the corresponding gain or expense will occur depending on the position you are holding and will be reflected in the account history.

• The above data are expressed in the base currency of each index.

• According to market practice, the actual execution data may change, please refer to MT4 software for details.

When the stock index goes ex-dividend, the dividend will be adjusted in the form of fund deduction.

You can view the fund deduction record with the following annotation “Div & stock index name & net lot” in the account history,It is the dividend adjustment. The long lot is calculated as a “positive value”, and the short lot is calculated as a “negative value”. The sum of the two is the “net lot”.

An example is as follows.

If you trade more than 5 lots of DJ30, you can view the “Div & DJ30 & 5” dividend adjustment record in the form of balance in the account history; View the “Div & DJ30 & -5” dividend adjustment records in the form of balance.

We recommend that you carefully evaluate your current positions and consider whether to hold it overnight.

If you have any questions or require assistance, please do not hesitate to contact [email protected]