Important Information

You are visiting the website that is operated by Ultima Markets Ltd, a licensed investment firm by the Financial Services Commission “FSC” of Mauritius, under license number GB 23201593. Please be advised that Ultima Markets Ltd does not have legal entities in the European Union.

If you wish to open an account in an EU investment firm and protected by EU laws, you will be redirected to Ultima Markets Cyprus Ltd (the “CIF”), a Cyprus investment firm duly licensed and regulated by the Cyprus Securities and Exchange Commission with license number 426/23.

Focus on GBP/NZD Today – 4th October 2023

Comprehensive GBP/NZD Analysis for October 4, 2023

In this comprehensive analysis, Ultima Markets brings you an insightful breakdown of GBP/NZD for 4th October 2023. 


Key Insight: RBNZ Interest Rate Decision and Economic Outlook

  • RBNZ Decision: The Reserve Bank of New Zealand (RBNZ) has opted to maintain the interest rate at 5.50%.
  • Consistency: Notably, this marks the third consecutive time that the central bank has refrained from adjusting interest rates.
  • GDP Growth: Despite a stronger-than-expected GDP growth in the June quarter, the overall growth outlook remains subdued.
  • Global Economic Risks: The RBNZ Committee has expressed concerns about downside risks to the global economic growth outlook in the medium term.
  • Short-Term Currency Trends: In the short term, the New Zealand dollar may face a depreciation trend.

Technical Analysis: A Closer Look on GBP/NZD Trading Charts


GBP/NZD Daily Chart Insights

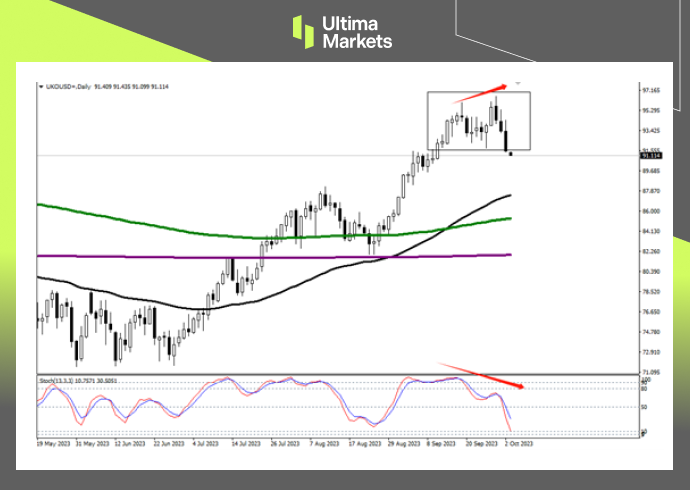
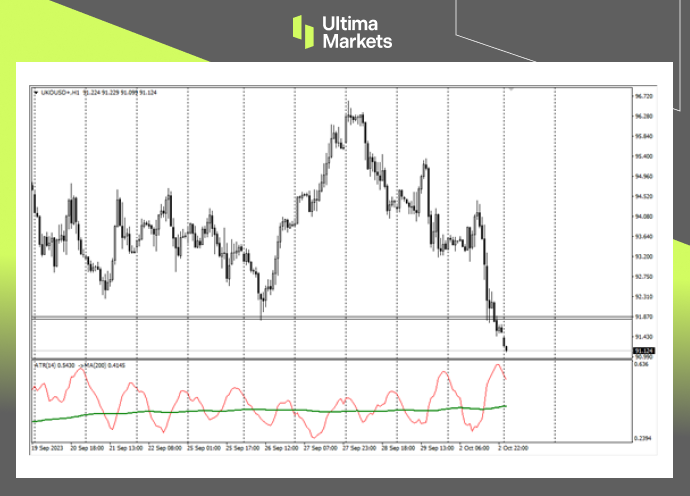
Reversal Structure: The daily chart illustrates a clear reversal structure, with the 240-day moving average acting as a significant resistance point.

GBP/NZD Daily Chart Insights by Ultima Markets MT4

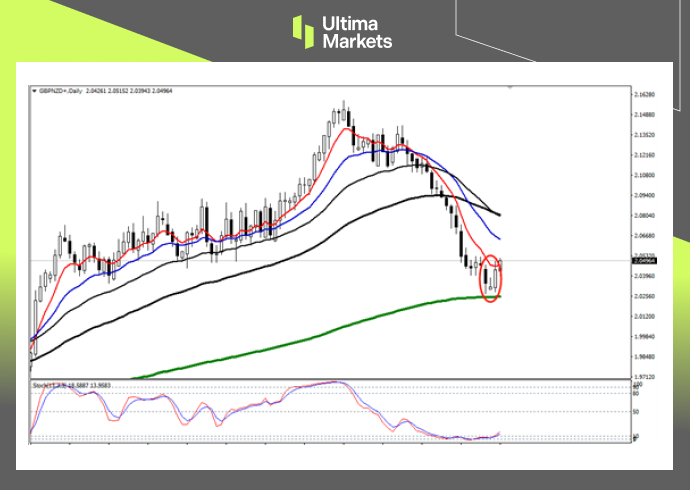
( Daily chart of GBP/NZD, source: Ultima Markets MT4) 

The stochastic oscillator technical indicator has also left the oversold area after being oversold for nearly 9 trading days. The market may continue to rebound and rise today. 


GBP/NZD 4-Hour Chart Observations

  • Motive Wave: A five-wave upward structure has emerged since the end of September, signaling a potential motive wave.
  • Moving Average Test: The market has surged rapidly and is nearing the 65-period moving average, a level to monitor for potential breakout.
GBP/NZD 4-Hour Chart Observations by Ultima Markets MT4

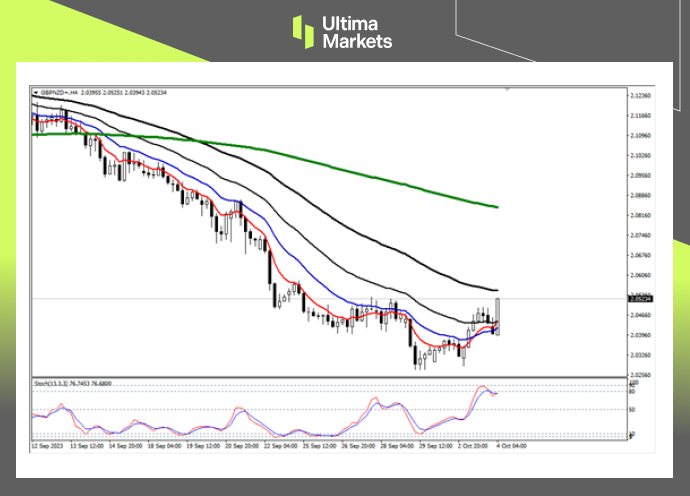
(4-hour chart of GBP/NZD, source: Ultima Markets MT4) 
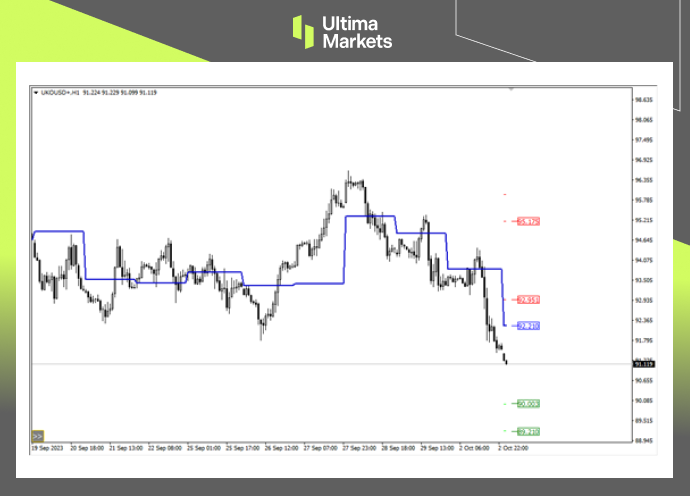

Pivot Indicator

Pivot Indicator by Ultima Markets MT4

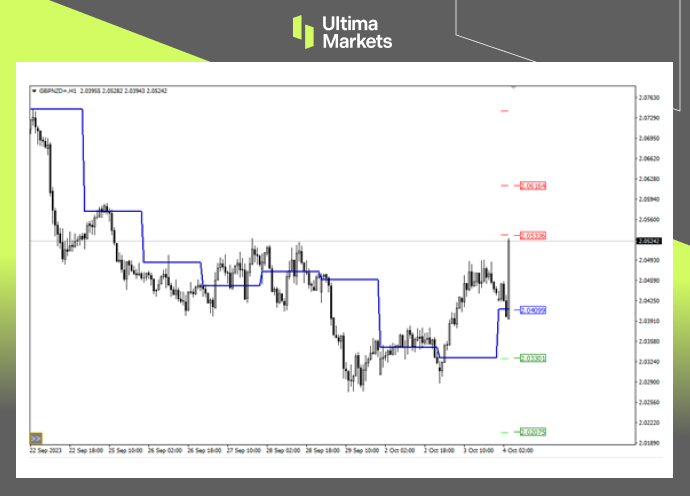
(1-hour chart of GBP/NZD, source: Ultima Markets MT4) 

Central Price: According to Ultima Markets MT4 pivot indicator, the central price for the day stands at 2.04099.

  • Bullish Outlook: A price movement above 2.04099 could trigger an upward momentum, targeting 2.05336 as the first level of resistance and 2.06164 as the second.
  • Bearish Outlook: A dip below 2.04099 may indicate a bearish trend, with the first support level at 2.03301 and the second at 2.02075.


Legal Documents 

Ultima Markets, a trading name of Ultima Markets Ltd, is authorized and regulated by the Financial Services Commission “FSC” of Mauritius as an Investment Dealer (Full-Service Dealer, excluding Underwriting) (license No. GB 23201593). The registered office address: 2nd Floor, The Catalyst, 40 Silicon Avenue, Ebene Cybercity, 72201, Mauritius. 

Disclaimer

Comments, news, research, analysis, price, and all information contained in the article only serve as general information for readers and do not suggest any advice. Ultima Markets has taken reasonable measures to provide up-to-date information, but cannot guarantee accuracy, and may modify without notice. Ultima Markets will not be responsible for any loss incurred due to the application of the information provided.  

Copyright © 2023 Ultima Markets Ltd. All rights reserved. 

Ultima Markets Index Dividend Adjustment Notice

When you are trading in Contracts for Difference (CFDs) on spot stock indices, if a component of the underlying stock index pays a dividend/dividend (payout) to its shareholders, your trading account will be adjusted ex-dividend at 00:00 server time on the same day, and the corresponding gain or expense will occur depending on the position you are holding and will be reflected in the account history.

• The above data are expressed in the base currency of each index.

• According to market practice, the actual execution data may change, please refer to MT4 software for details.

When the stock index goes ex-dividend, the dividend will be adjusted in the form of fund deduction.

You can view the fund deduction record with the following annotation “Div & stock index name & net lot” in the account history,It is the dividend adjustment. The long lot is calculated as a “positive value”, and the short lot is calculated as a “negative value”. The sum of the two is the “net lot”.

An example is as follows.

If you trade more than 5 lots of DJ30, you can view the “Div & DJ30 & 5” dividend adjustment record in the form of balance in the account history; View the “Div & DJ30 & -5” dividend adjustment records in the form of balance.

We recommend that you carefully evaluate your current positions and consider whether to hold it overnight.

If you have any questions or require assistance, please do not hesitate to contact [email protected]

US PMI Improved, But Stagnant Inflation Loomed 


US Manufacturing PMI Shows Improvement, but Stagnant Inflation Remains a Concern

The ISM manufacturing purchasing managers’ index rose to 49 in September from 47.6 last month, well above market expectations of 47.8, reflecting the slowest contraction in the U.S. manufacturing industry in ten months.

Even as the economic slowdown improved, data still showed U.S. factory activity contracting on a month-on-month basis for nearly a year in a row, underscoring the impact of rising borrowing costs from the Federal Reserve on the industry.


Although new orders fell for the 13th consecutive month, the pace of decline slowed significantly as the changing supply chain environment pushed customers to take on more engineering (process).

Production rebounded from August’s stagnation and set the largest increase since July 2022. 

(ISM Manufacturing PMI, Institute for Supply Management) 


S&P Global US Manufacturing PMI

The S&P Global US Manufacturing PMI was revised higher to 49.8 in September 2023, surpassing the preliminary estimate of 48.9 and exceeding August’s final reading of 47.9.

The latest figure pointed to a fifth consecutive month of contraction in the sector’s health, albeit only fractional. Output increased at a marginal pace that was nonetheless the fastest since May.

In contrast, job creation remained moderate, and new orders continued to decline for the fifth consecutive month, reflecting the impact of high interest rates and inflation on consumer demand.


Inflation and Business Confidence

On the price front, both input costs and output charges accelerated, though inflation rates remained historically low, well below the levels seen over the past three years.

Moreover, business confidence reached its highest level since April 2022, driven by optimism about an impending improvement in demand conditions.  


Stagnant Inflation (Stagflation)

(US Manufacturing PMI, S&P Global) 

Based on the surveys, although survey data have improved overall, manufacturing reports show that production continues to slow down, and prices are accelerating again. The phenomenon presented is “stagnant inflation (Stagflation)“.


Disclaimer  

Comments, news, research, analysis, price, and all information contained in the article only serve as general information for readers and do not suggest any advice. Ultima Markets has taken reasonable measures to provide up-to-date information, but cannot guarantee accuracy, and may modify without notice. Ultima Markets will not be responsible for any loss incurred due to the application of the information provided. 

Focus on Brent Oil Today – 3rd October 2023 


Comprehensive Brent Oil Analysis for October 3, 2023

In this comprehensive analysis, Ultima Markets brings you an insightful breakdown of the Brent Oil (UKOUSD) for 3rd October 2023. 


Key Takeaways

Key Point: The lifting of the U.S. government shutdown crisis, coupled with robust PMI data, has driven the U.S. dollar index to 107, a level not seen since November last year. This surge in the dollar’s strength has led to a sharp decline in non-U.S. currencies and a corresponding dip in crude oil prices, reaching three-week lows.

  • Increased OPEC Production: Notably, OPEC’s oil production increased by 120,000 barrels per day in September compared to August, reaching 27.73 million barrels per day for the second consecutive month.
  • Bearish Sentiment Emerges: Concerns over increased supply and the impact of high interest rates on demand have prompted bearish sentiment in the crude oil market.

Brent Oil Technical Analysis


Brent Oil Daily Chart Analysis

Brent Oil Daily Chart Analysis By Ultima Markets MT 4

( Daily chart of BRENT OIL, source: Ultima Markets MT4) 

Key Point: The daily chart reveals a rapid decline in crude oil prices, signaling a strong bearish trend.

Stochastic Oscillator Signals

Key Point: Stochastic oscillator technical indicators suggest a divergence from market prices, indicating a high probability of short-term bearishness.


Brent Oil 1 Hour Chart Analysis

Brent Oil 1 Hour Chart Analysis by Ultima Markets MT4

(1hour chart of BRENT OIL, source: Ultima Markets MT4) 

Key Point: Recent significant volatility is observed on the 1-hour chart, with the ATR combination indicator signaling an effective breakthrough. Traders should exercise caution and monitor entry opportunities.


Pivot Indicator

Pivot Indicator For Brent Oil in Ultima Markets MT4

(1-hour chart of BRENT OIL, source: Ultima Markets MT4) 

Key Point: According to the pivot indicator in Ultima Markets’ MT4 platform, the central price of the day stands at 92.210. Technical outlook:

  • Bullish Scenario: Above 92.210, with targets set at 92.951 and 95.175.
  • Bearish Scenario: Below 92.210, with targets at 90.003 and 89.210.


Legal Documents 

Ultima Markets, a trading name of Ultima Markets Ltd, is authorized and regulated by the Financial Services Commission “FSC” of Mauritius as an Investment Dealer (Full-Service Dealer, excluding Underwriting) (license No. GB 23201593). The registered office address: 2nd Floor, The Catalyst, 40 Silicon Avenue, Ebene Cybercity, 72201, Mauritius. 

Disclaimer

Comments, news, research, analysis, price, and all information contained in the article only serve as general information for readers and do not suggest any advice. Ultima Markets has taken reasonable measures to provide up-to-date information, but cannot guarantee accuracy, and may modify without notice. Ultima Markets will not be responsible for any loss incurred due to the application of the information provided.  

Copyright © 2023 Ultima Markets Ltd. All rights reserved. 

Ultima Markets Index Dividend Adjustment Notice

When you are trading in Contracts for Difference (CFDs) on spot stock indices, if a component of the underlying stock index pays a dividend/dividend (payout) to its shareholders, your trading account will be adjusted ex-dividend at 00:00 server time on the same day, and the corresponding gain or expense will occur depending on the position you are holding and will be reflected in the account history.

• The above data are expressed in the base currency of each index.

• According to market practice, the actual execution data may change, please refer to MT4 software for details.

When the stock index goes ex-dividend, the dividend will be adjusted in the form of fund deduction.

You can view the fund deduction record with the following annotation “Div & stock index name & net lot” in the account history,It is the dividend adjustment. The long lot is calculated as a “positive value”, and the short lot is calculated as a “negative value”. The sum of the two is the “net lot”.

An example is as follows.

If you trade more than 5 lots of DJ30, you can view the “Div & DJ30 & 5” dividend adjustment record in the form of balance in the account history; View the “Div & DJ30 & -5” dividend adjustment records in the form of balance.

We recommend that you carefully evaluate your current positions and consider whether to hold it overnight.

If you have any questions or require assistance, please do not hesitate to contact [email protected]

2023 Live Trading Competition  

Live Trading Competition is here!
Be ready to be on top.

We are excited to announce and introduce our first-ever Live Trading Competition!

This is your chance to demonstrate your trading prowess in a real-time trading environment, compete against fellow traders, and win exciting prizes.

Whether you’re a seasoned trader or just starting out, the 2023 Live Trading Competition is designed to provide an exhilarating experience and an opportunity to learn and grow.

Ten participants who adhere to all contest rules and achieve the highest returns (based on the percentage increase in account equity) during the competition period will be declared the top winners and receive the following prizes:

Get yourself ready to conquer and dominate the trading world. Register now to secure your spot in the Live Trading Competition!

If you have any questions or need assistance with registration, please do not hesitate to contact our dedicated support team at [email protected].

Ultima Markets Holiday Trading Hours Adjustment Notice

The trading sessions of some products will be adjusted due to international holidays. Please refer to the following details:
Holiday Date Adjustments (Product / Actions)
National Day 2023.10.02 Market Closed HK50, HK50ft
National Foundation Day 2023.10.03 Market Closed USDKRW
Indigenous People’s Day 2023.10.09 Market Closed USDBRL, USDCLP, USDCOP,
USDTWD, USDKRW
ROC National Day 2023.10.10 Market Closed USDTWD
Our Lady of Aparecida Day 2023.10.12 Market Closed FX / USDBRL,
Indices / BVSPX
Day of the Races 2023.10.16 Market Closed USDCOP
Chung Yeung Festival 2023.10.23 Market Closed HK50, HK50ft
Reformation Day 2023.10.27 Market Closed USDCLP

Important Reminder:

  • • The mentioned times are based on DST system time GMT+3.
  • • Liquidity providers might adjust the trading sessions base on market conditions. The up-to-date execution data should be subject to information on MT4.
    If you have any questions or require assistance, please do not hesitate to contact [email protected]

Ultima Markets Index Dividend Adjustment Notice

When you are trading in Contracts for Difference (CFDs) on spot stock indices, if a component of the underlying stock index pays a dividend/dividend (payout) to its shareholders, your trading account will be adjusted ex-dividend at 00:00 server time on the same day, and the corresponding gain or expense will occur depending on the position you are holding and will be reflected in the account history.

• The above data are expressed in the base currency of each index.

• According to market practice, the actual execution data may change, please refer to MT4 software for details.

When the stock index goes ex-dividend, the dividend will be adjusted in the form of fund deduction.

You can view the fund deduction record with the following annotation “Div & stock index name & net lot” in the account history,It is the dividend adjustment. The long lot is calculated as a “positive value”, and the short lot is calculated as a “negative value”. The sum of the two is the “net lot”.

An example is as follows.

If you trade more than 5 lots of DJ30, you can view the “Div & DJ30 & 5” dividend adjustment record in the form of balance in the account history; View the “Div & DJ30 & -5” dividend adjustment records in the form of balance.

We recommend that you carefully evaluate your current positions and consider whether to hold it overnight.

If you have any questions or require assistance, please do not hesitate to contact [email protected]

Top 10 IC Design Houses Recorded Revenue Up 12.5% QOQ, And Growth Is Expected To Extend In 3Q23 


The Rise of NVIDIA: A Dominant Force in IC Design

In the fast-paced world of integrated circuit (IC) design, the tides are constantly shifting, and the recent performance of the industry’s top players has been nothing short of remarkable.

According to TrendForce reports, fueled by an AI-driven inventory stocking frenzy across the supply chain, 2Q23 revenue for the top 10 global IC design powerhouses soared to US $38.1 billion, marking a 12.5% quarterly increase.

In this rising tide, NVIDIA seized the crown, officially dethroning Qualcomm as the world’s premier IC design house, while the remainder of the leaderboard remained stable.  

(2Q23 World’s top 10 IC design houses, TrendForce) 

NVIDIA: The New Kingpin

NVIDIA benefited from global CSPs (cloud service providers), internet company and enterprise generative AI, large-scale language model import application demands, and its data center revenue increased by as much as 105% quarterly.

In addition, revenue from gaming and professional visualization businesses also continued to grow, driven by new products.

Overall, revenue in the second quarter reached US$11.33 billion, a quarterly increase of 68.3%.   


Qualcomm’s Challenges

Qualcomm’s Q2 took a hit as the Android smartphone sector grappled with dwindling demand and Apple’s modem pre-purchases resulted in a subdued seasonal rhythm.

Consequently, their revenue slid by 9.7%, rounding off at about US$7.17 billion. 


Broadcom’s Mixed Bag

Broadcom benefited from the sales of high-end switches and routers catalyzed by generative AI, its NetCom business increased by about 9% quarterly.

However, offset by the decline in server storage, broadband, and wireless business, the second quarter revenue was roughly the same as the previous quarter at about $6.9 billion.  


AMD’s Steady Stance

AMD’s overall second-quarter revenue was roughly the same as the previous quarter at about US$5.36 billion, due to the decline in gaming GPU sales and embedded business in the second quarter.  


The Outlook for IC Design Houses

Although the inventory levels of semi-companies have improved significantly compared with those in 1H23, the outlook for the second half of the year tends to be conservative because of the weak market demand.

It is worth noting that the wave of generative AI and large-scale language model deployment has emerged among Internet companies and private enterprises.

It is expected that AI will be more helpful to related supply chain operations in the second half of the year, and the average sales unit price of such products will be higher than that of consumer products.

As a result, the world’s top ten IC design revenue will continue to have double-digit quarterly growth in the third quarter, and the output value is expected to reach a new high. 


Disclaimer  

Comments, news, research, analysis, price, and all information contained in the article only serve as general information for readers and do not suggest any advice. Ultima Markets has taken reasonable measures to provide up-to-date information, but cannot guarantee accuracy, and may modify without notice. Ultima Markets will not be responsible for any loss incurred due to the application of the information provided.