Important Information

You are visiting the website that is operated by Ultima Markets Ltd, a licensed investment firm by the Financial Services Commission “FSC” of Mauritius, under license number GB 23201593. Please be advised that Ultima Markets Ltd does not have legal entities in the European Union.

If you wish to open an account in an EU investment firm and protected by EU laws, you will be redirected to Ultima Markets Cyprus Ltd (the “CIF”), a Cyprus investment firm duly licensed and regulated by the Cyprus Securities and Exchange Commission with license number 426/23.

What is the Fed’s Next Move After Jackson Hole? 

As a mouthpiece of the Fed, the Jackson Hole Economic Symposium always attracts the eyeballs of numerous investors. Considering the current turbulent global economic situation, this year’s meeting is undoubtedly eye-catching. The three-day symposium officially ended in August, and the speeches of renowned financial names captured the world’s attention. 

This article is going to unriddle hidden messages in speeches and help you get insight into future investment trends. 

Fed message iterated and no rate cuts in sight  

The spotlight at the meeting was the speech by Federal Reserve Chairman Jerome Powell. He patiently reiterated the importance of U.S. interest rate decisions on inflation: “The Federal Reserve’s responsibility is to reduce inflation to the 2% target. Although inflation has fallen from highs, it is considered too steep. The Fed will be prepared to raise interest rates further if necessary and keep restrictive policies going until it is confident that inflation will fall sustainably toward the target. ” From the words, the Fed still attaches great importance to achieving the inflation target, and it also greatly dispels market expectations for interest rate cuts.    

Inflation downtrend becoming stagnant 

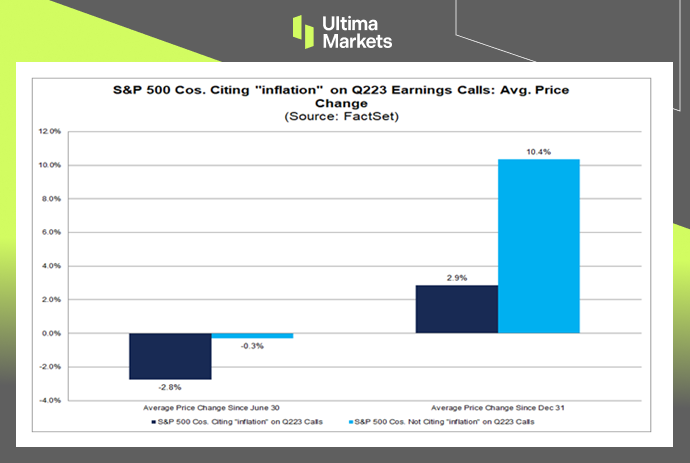
Judging from the figures released, although the economy has slowed down somewhat, consumption seemingly remains intact. After falling from highs, price levels have entered a stagnant state. This phenomenon will undoubtedly arouse market concerns in the high-interest rate environment. The U.S. Department of Commerce reported on July 28th that the personal consumption expenditures (PCE) index increased by 3.0% year-on-year in June, slightly lower than market expectations of 3.1%. Food and energy prices are susceptible to fluctuations due to global factors, which may send misleading signals to the inflation outlook. Therefore, the Fed focuses more on core PCE inflation. Excluding food and energy prices, core PCE increased by 4.1% year-on-year in June, which was lower than market expectations of 4.2% and 4.6% of the previous value, the smallest increase since September 2021. The U.S. Department of Commerce announced on August 31 that PCE increased by 3.3% annually in July, in line with market expectations. The core PCE increased by 4.2% year-on-year in July, slightly higher than the 4.1% in June, but in line with market expectations.  

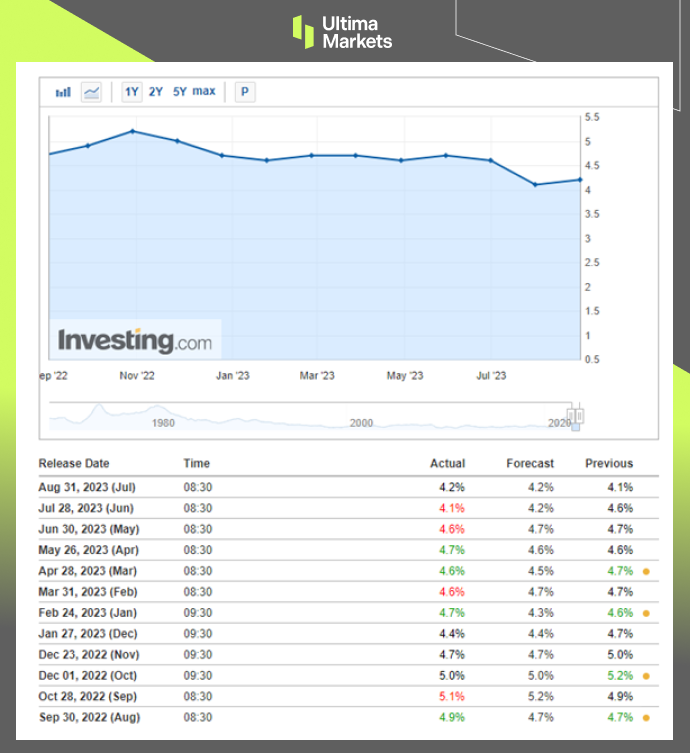
(Core Personal Consumption Expenditure PCE Index, Investing.com) 

Resilient labor market 

In addition, the job market continues to remain resilient, indicating that the U.S. economy not heading for a recession. However, inflation seems to be difficult to decline further as a result. The U.S. Department of Labor announced that nonfarm payroll increased by 187,000 in July, slightly lower than market estimates of 200,000. Although the number missed expectations, it actually went up from the downward revision of 185,000 in June. The unemployment rate was 3.5%, while the market consensus expected the unemployment rate to remain stable at 3.6%. The unemployment rate is slightly higher than the lowest level since late 1969. The average hourly wages, the Fed’s compass for inflation, rose 0.4% for the month and at an annual rate of 4.4%. Both figures were 0.3% and 4.2% higher than their respective forecasts.  

Consult history when observing reality, Reality does not exist without history

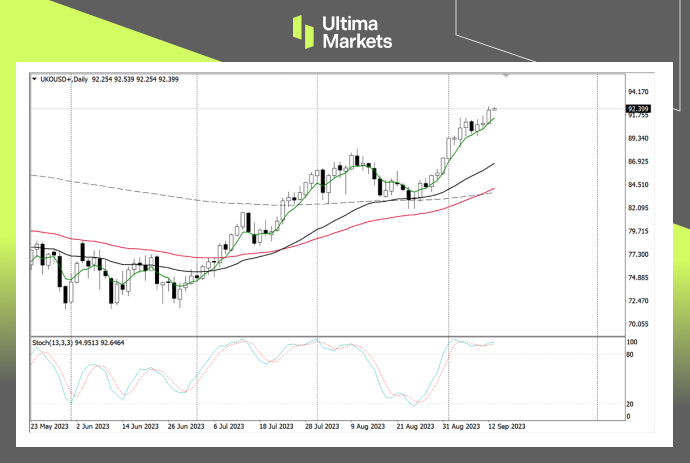
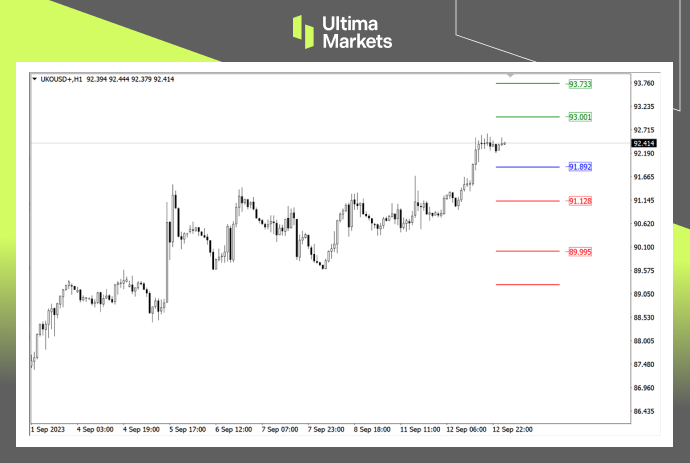
As we look for today’s answer from history, it is not difficult to discover the Fed’s concerns and why the chairman often adopts a reserved tone in his remarks. The long-run quantitative easing policy has made people accustomed to the low-interest environment. How did people deal with inflation? Is there a period in history that matches the present so that we can find clues? From the comparison of the diagram below, we can see that the yellow curve, representing CPI from 2013 to 2023, closely replicates the one dated 1966 to 1976 (blue line), with inflation rising sharply and then cooling down after being controlled. When the time sequence entered the late 1970s, the revolution in Iran caused tension in the oil market, and inflation soon reignited. The international crude oil price soared from about $15 per barrel in 1979 to doubling to $ 39 in February 1981. Price levels went skyrocketed. The late 70s CPI soared higher than the peak in 1974-75! Now, OPEC+ allies are implementing a voluntary production reduction policy until the end of the year in an attempt to deepen their operations in the oil market. As expected, oil prices have reached the year-to-date high of $90 per barrel at the beginning of autumn. Although economic data show inflation has cooled, history tells us it is hard to defeat. The oil cuts have fostered uncertainties on the path to winning the inflation battle. The Federal Reserve must stay alert and respond fast. Whenever there is an overly optimistic atmosphere in the market, the Federal Reserve will release a hawkish message to suppress it, conveying that interest rates must remain high and last longer. Its verbal warning works best when the global economic environment is fragile.  

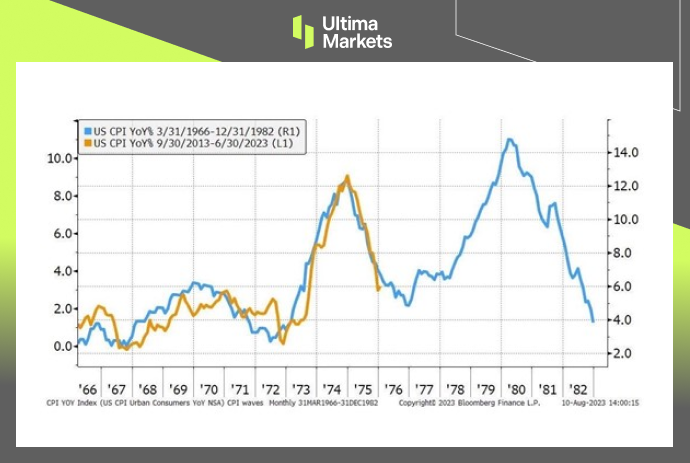
(US CPI YoY%, 1966-1982 Blue Line V.S. 2013-2023 Yellow Line) 

Natural rate of interest possibly rises over time  

The natural rate of interest (r-star) has recently become a popularly debated topic among Fed officials, and some officials believe the neutral rate of interest might have gone up. The r-star is the real interest rate set by the central bank to keep the economy operating at full employment and price stability. Simply saying, at the neutral interest rate, the economy is neither expanding nor contracting. According to data from the Federal Reserve Bank of New York, r-star has been between 2.0% and 3.5% from 2000 to 2009 and remained near 1.0% since then. The Federal Reserve Bank of New York estimates that the current r-star hovers between 0% and 0.5%. Without the monetary easing policy, the U.S. economy seems to be intact and still running well in a relatively high interest-rate environment. Does this mean that the neutral interest rate has already quietly rebounded? However, the neutral interest rate has always been an abstract observation tool, which is not easy to measure and can only be reviewed after the fact occurs. With the uprise of the new economy and geopolitical risks, the Federal Reserve’s mission has become more complex, and monetary policy must become innovative and not limited to interest rate setting. What is certain is that the market’s desire to return to the ultra-low interest times of the past no longer exists.  

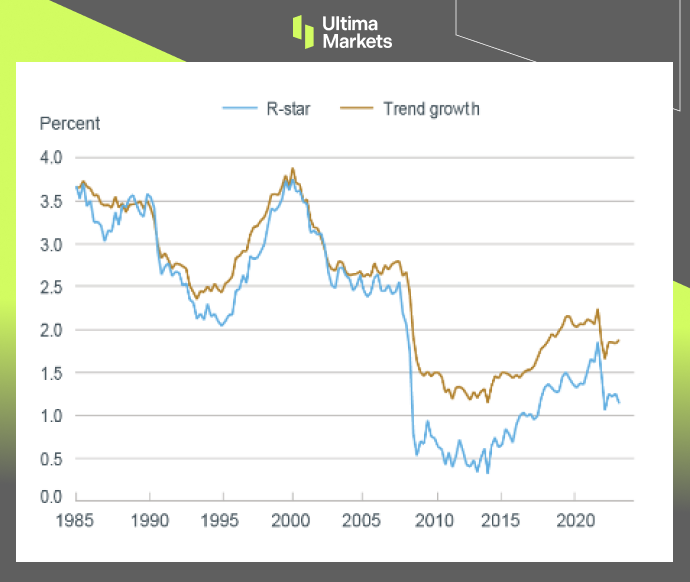
(Natural rate of interest r-star, Fed NY)  

Summary 

As Powell said, the Fed still needs to work harder to bring inflation down to 2% sustainably, and this may require two conditions: A period of low economic growth and a cooling labor market. Speaking of economic growth, GDP growth in 1H23 is higher than the long-term trend, and recent consumption data has also been particularly strong. As for the labor market, it has been rebalancing over the past year.  

Therefore, monetary policy needs to remain flexible. It is expected that interest rates will be raised again in September or November, while the interest rate cut expected by the market may have to wait until the second half of 2024. According to FedWatch, CME Group’s interest rate forecast tool, after Jackson Hole, the probability that the Fed will not raise interest rates in September has risen to 88.5%. Certainly, we cannot rule out the possibility that unexpected situations may occur, resulting in the Fed eventually raising interest rates in September.  

Disclaimer 

The comments, news, research, analyses, prices, and all information contained in this article can only be regarded as general information and are provided only to help readers understand the market situation and do not constitute investment advice. Ultima Markets has taken reasonable steps to provide up-to-date information, but cannot guarantee the accuracy and may modify without notice. Ultima Markets will not be responsible for any loss incurred due to the application of the information provided. 

Ultima Markets Index Dividend Adjustment Notice

When you are trading in Contracts for Difference (CFDs) on spot stock indices, if a component of the underlying stock index pays a dividend/dividend (payout) to its shareholders, your trading account will be adjusted ex-dividend at 00:00 server time on the same day, and the corresponding gain or expense will occur depending on the position you are holding and will be reflected in the account history.

• The above data are expressed in the base currency of each index.

• According to market practice, the actual execution data may change, please refer to MT4 software for details.

When the stock index goes ex-dividend, the dividend will be adjusted in the form of fund deduction.

You can view the fund deduction record with the following annotation “Div & stock index name & net lot” in the account history,It is the dividend adjustment. The long lot is calculated as a “positive value”, and the short lot is calculated as a “negative value”. The sum of the two is the “net lot”.

An example is as follows.

If you trade more than 5 lots of DJ30, you can view the “Div & DJ30 & 5” dividend adjustment record in the form of balance in the account history; View the “Div & DJ30 & -5” dividend adjustment records in the form of balance.

We recommend that you carefully evaluate your current positions and consider whether to hold it overnight.

If you have any questions or require assistance, please do not hesitate to contact [email protected]

The Debate Between Hawks and Doves Heating up at ECB 

The ECB Debate: Hawks vs. Doves – Charting a Path Through Uncertainty

Since July 2022, interest rates in the euro area have increased by 4.25 percentage points. But as signs of recession in the region become increasingly apparent, with annual price growth now at half its peak of 10.6%, disagreements have emerged within the ECB over the future direction of interest rates. Some officials prefer to adding 25 bps, while others want to suspend interest rate hikes. 

At the end of the summer, indicators of manufacturing and services sectors in the eurozone pointed to a slowdown. Higher interest rates of 3.75%~ 4.50% restrict bank lending. In fact, on September 11, the European Commission lowered the euro zone’s growth outlook for 2023 from 1.1% to 0.8% due to shrinkage in Germany, the largest economy in the region. 


A Diverging Path at ECB

Three aspects make ECB decision-making more difficult: 

1. Core inflation remains high, and although it has slowed somewhat, it grew at 5.3% last month, well above the historical average. Annual wage increases uplift price pressures as the labor market appears tight, particularly in the services sector. 

2. Rising oil prices due to production cuts by OPEC+ allies and strikes at Australian LNG plants have added more variables to the eurozone economy. Prices are likely to remain high for longer. 

3. There are apparent differences among ECB officials. After inflation falls, the European Central Bank is more willing to convey a hawkish tendency. The European Central Bank has defied market expectations in the past. To regain its prestige, it will continue to emphasize its anti-inflation credibility. 


Christine Lagarde’s Balancing Act

Regardless of the decision, European Central Bank President Christine Lagarde must firmly express the ECB’s commitment to achieving its inflation target and say that interest rate cuts are still a distant prospect. It is a difficult decision, but actions speak louder than words when it comes to getting the message across. 


Conclusion: Christine Lagarde’s Crucial Role

In conclusion, the ongoing ECB debate between the hawks and doves underscores the intricate decision-making process central bankers must navigate amidst economic uncertainties.

With core inflation remaining elevated, oil price volatility adding another layer of complexity, and divergent perspectives within the ECB, President Christine Lagarde faces a formidable task.

She must effectively communicate the ECB’s dedication to achieving its inflation target and convey that interest rate cuts remain a distant prospect.

In this critical juncture, actions will speak louder than words in conveying the ECB’s stance to the public and the financial markets.

In light of the multifaceted challenges, the world watches with keen interest, as the ECB’s final decision carries profound implications for the eurozone’s economic landscape.


Disclaimer  

Comments, news, research, analysis, price, and all information contained in the article only serve as general information for readers and do not suggest any advice. Ultima Markets has taken reasonable measures to provide up-to-date information, but cannot guarantee accuracy, and may modify without notice. Ultima Markets will not be responsible for any loss incurred due to the application of the information provided. 

9.13 Commodity Daily Brent Oil 

Focus on Brent Oil today. 

Fundamentally, with OPEC and EIA predicting that production cuts will tighten the market in the coming months, Brent crude oil has finally returned to above $90. The International Energy Agency will also release its monthly report today, which is expected to provide more clues to market conditions. The market focuses on whether the report also emphasizes that crude oil production will tighten supply for the rest of this year. 

Technically, the stochastic oscillation in daily chart has once again risen with a golden cross, indicating the arrival of bulls. The moving average group also raised their heads to support the market’s further upward trend. 

( Daily chart of Brent Oil, source: Ultima Markets MT4) 

There is currently no moving average suppression above crude oil, and there is little resistance for bulls. Although the current signal of the stochastic oscillator occurs in the overbought area, judging from the chart, even if the market declines again, it will still have the support of the moving average group. 

(1-hour chart of Brent Oil, source: Ultima Markets MT4) 

On the 1-hour period, crude oil finally broke through resistance and moved upward yesterday after oscillating for nearly 5 trading days. At present, the stochastic oscillator crosses downwards, and the market has a potential adjustment probability in the Asian market. Priority is given to the resistance level for breakthroughs. After waiting for the stochastic oscillator to cross again, traders can pay attention to the long entry opportunities. 

(1-hour chart of Brent Oil, source: Ultima Markets MT4) 

According to the pivot indicator in Ultima Markets MT4, the central price of the day was 91.892. 

Bullish above 91.892, first target 93.001, second target 93.733 

Bearish below 91.892, first target is 91.128, second target is 89.995 

Disclaimer 

Comments, news, research, analysis, prices and other information contained in this article can only be regarded as general market information, provided only to help readers understand the market situation, and do not constitute investment advice. Ultima Markets will not be responsible for any loss or loss (including but not limited to any loss of profits) that may arise from the direct or indirect use or reliance on such information. 

Ultima Markets – Trading Session Adjustment for CHINA50

The trading sessions for CHINA50 will be updated from 18 September 2023 as per the following schedule:
Date Product Original Trading Sessions (GMT+3) Updated Trading Sessions (GMT+3)
2023/9/18 (Mon.) CHINA50 01:00-03:55
04:00-11:55
12:00-24:00
04:00-11:55
12:00-24:00

Friendly Reminder

  • • The mentioned times are based on DST system time GMT+3.
  • • Liquidity providers might adjust the trading sessions base on the dynamic nature of market conditions. The up-to-date execution data should be subject to information on the MetaTrader software/application.
    If you have any questions or require assistance, please do not hesitate to contact [email protected]

Ultima Markets Index Dividend Adjustment Notice

When you are trading in Contracts for Difference (CFDs) on spot stock indices, if a component of the underlying stock index pays a dividend/dividend (payout) to its shareholders, your trading account will be adjusted ex-dividend at 00:00 server time on the same day, and the corresponding gain or expense will occur depending on the position you are holding and will be reflected in the account history.

• The above data are expressed in the base currency of each index.

• According to market practice, the actual execution data may change, please refer to MT4 software for details.

When the stock index goes ex-dividend, the dividend will be adjusted in the form of fund deduction.

You can view the fund deduction record with the following annotation “Div & stock index name & net lot” in the account history,It is the dividend adjustment. The long lot is calculated as a “positive value”, and the short lot is calculated as a “negative value”. The sum of the two is the “net lot”.

An example is as follows.

If you trade more than 5 lots of DJ30, you can view the “Div & DJ30 & 5” dividend adjustment record in the form of balance in the account history; View the “Div & DJ30 & -5” dividend adjustment records in the form of balance.

We recommend that you carefully evaluate your current positions and consider whether to hold it overnight.

If you have any questions or require assistance, please do not hesitate to contact [email protected]

Fewer S&P 500 Companies Citing “Inflation” in 2Q23 Conference Calls 

Deciphering the Decline in S&P 500 Companies Citing “Inflation” in 2Q23 Conference Calls

Through Document Search, FactSet searched for the term “inflation” in the conference call transcripts of all the S&P 500 companies that conducted earnings conference calls from June 15 through September 7. 


The Numerical Dip in S&P 500

Of these companies, 296 cited the term “inflation” during their earnings calls for the second quarter. This is the lowest number of S&P 500 companies citing “inflation” on earnings calls going back to Q2 2021 (221). It also marks the fourth consecutive quarter in which the number of S&P 500 companies citing the term “inflation” has declined quarter-over-quarter.

However, it should be noted that the number of S&P 500 companies citing “inflation” on earnings calls for Q2 2023 is still well above the 5-year average of 217 and the 10-year average of 168. 


Sectoral Insights in S&P 500

At the sector level, the Financials (49) and Industrials (46) sectors have the highest number of companies that cited “inflation” on earnings calls for Q2. However, the Consumer Staples (86%), Consumer Discretionary (76%), and Materials (76%) sectors have the highest percentages of companies that cited “inflation” on their Q2 earnings calls during this period. 


Impact on Stock Performance in S&P 500 Companies

It is interesting to note that S&P 500 companies that cited “inflation” on Q2 earnings calls have seen a weaker average stock price performance in recent months compared to S&P 500 companies that did not cite “inflation” on Q2 earnings calls.

For S&P 500 companies that cited “inflation” on Q2 earnings calls, the average change in price since June 30 is -2.8% and the average change in price since December 31 is 2.9%. For S&P 500 companies that did not cite “inflation” on Q2 earnings calls, the average change in price since June 30 is -0.3% and the average change in price since December 31 is 10.4%. 

S&P 500 Survey by FactSet

(Survey by FactSet) 


Conclusion

In conclusion, while the decline in the number of S&P 500 companies referencing “inflation” in their earnings calls is noteworthy, it’s crucial to view these statistics within the broader context.

The relative high numbers compared to historical averages indicate that the topic remains relevant. Additionally, the varying stock performance for companies mentioning “inflation” presents a compelling puzzle for investors and analysts alike.

As the financial landscape continues to evolve, it is imperative to closely monitor these trends to make informed investment decisions.


Disclaimer  

Comments, news, research, analysis, price, and all information contained in the article only serve as general information for readers and do not suggest any advice. Ultima Markets has taken reasonable measures to provide up-to-date information, but cannot guarantee accuracy, and may modify without notice. Ultima Markets will not be responsible for any loss incurred due to the application of the information provided. 

9.12 FX Daily GBP/USD 

Focus on GBP/USD today. 

Fundamentally, UK is to release its latest August unemployment data on Tuesday. The previous PMI final value data for the manufacturing industry confirmed a downward trend, shrinking for the sixth consecutive month. If the job market shows weakness as well, although inflationary pressure decreases, the outlook for the UK economy may be interpreted as sluggish by the market. 

Technically, it can be observed from the weekly chart of the pound that although the random volatility indicator is still in a downward trend, the market is still trapped in the volatility range of the moving average group. 

( Weekly chart of GBP/USD, source: Ultima Markets MT4) 

The 5-week moving average suppressed the rebound in the exchange rate, while the 33-week and 65-week moving averages supported further downward movements in the market. There is still a possibility of further volatility in the market this week. 

(Daily chart of GBP/USD, source: Ultima Markets MT4) 

The short forces on the copper daily chart temporarily have the upper hand. The stochastic oscillator crosses downwards. Since the downward trend since early August has been a downward motive wave, there is a certain probability that the recent decline will continue the extended downward trend. 

(1-hour chart of GBP/USD, source: Ultima Markets MT4) 

On the daily chart, yesterday’s rebound in the market led to a random volatility indicator sending out a bullish signal, but due to yesterday’s K line being only a cross star, the upward momentum of the rebound may be limited. Even if the rebound continues, it is still necessary to conservatively look towards the resistance 1.25675. 

(1-hour chart of GBP/USD, source: Ultima Markets MT4) 

According to the pivot indicator in Ultima Markets MT4, the central price on that day is 1.25065, 

Bullish above 1.25065, with the first target of 1.25511 and the second target of 1.25930 

Bearish below 1.25065, with first target 1.24647 and second target 1.24209 

Disclaimer 

Comments, news, research, analysis, prices and other information contained in this article can only be regarded as general market information, provided only to help readers understand the market situation, and do not constitute investment advice. Ultima Markets will not be responsible for any loss or loss (including but not limited to any loss of profits) that may arise from the direct or indirect use or reliance on such information. 

Ultima Markets Index Dividend Adjustment Notice

When you are trading in Contracts for Difference (CFDs) on spot stock indices, if a component of the underlying stock index pays a dividend/dividend (payout) to its shareholders, your trading account will be adjusted ex-dividend at 00:00 server time on the same day, and the corresponding gain or expense will occur depending on the position you are holding and will be reflected in the account history.

• The above data are expressed in the base currency of each index.

• According to market practice, the actual execution data may change, please refer to MT4 software for details.

When the stock index goes ex-dividend, the dividend will be adjusted in the form of fund deduction.

You can view the fund deduction record with the following annotation “Div & stock index name & net lot” in the account history,It is the dividend adjustment. The long lot is calculated as a “positive value”, and the short lot is calculated as a “negative value”. The sum of the two is the “net lot”.

An example is as follows.

If you trade more than 5 lots of DJ30, you can view the “Div & DJ30 & 5” dividend adjustment record in the form of balance in the account history; View the “Div & DJ30 & -5” dividend adjustment records in the form of balance.

We recommend that you carefully evaluate your current positions and consider whether to hold it overnight.

If you have any questions or require assistance, please do not hesitate to contact [email protected]

The Surreal Saga of UK Government’s Skyrocketing Debt

The UK’s Mounting Debt Crisis

UK government debt has soared more than 40% since the Covid-19 outbreak in March 2020, reaching nearly 2.6 trillion pounds ($3.3 trillion), the highest level since the early 2020s and about the same as the country’s annual gross domestic product.


Inflation-Linked Debt: A Troubling Reality

Although some developed countries, for example, the US has debts as a high percentage in its GDP, the UK is unique in this case because 1/4 of its government debt is “index-linked to inflation”.

As prices surged in the UK over the past 18 months, so have government repayments of interest on inflation-linked bonds.


The Burden of High Inflation

In the latest fiscal year, high inflation resulted in the highest debt ratio in 40 years, weighing on the country’s finances as it grapples with weak economic growth and an election looming pressure.

The credit ratings company Fitch said, “Britain has a higher debt-repay as a share of government revenue than any other advanced economy.”


The Looming Specter of Credit Downgrade

Britain’s growing debt burden puts it in a precarious position. A downgrade of the country’s credit rating could further raise borrowing costs, although the impact is likely to be limited.

Earlier this month, Fitch canceled the U.S.’s AAA rating, one of the reasons was the increase in the U.S. debt ratio.

Fitch ‘s current rating outlook on the UK is negative, which means the risk of the country’s rating being downgraded to A from the current AA- rating increases.


Future Outlook: Waiting for Rating Agencies’ Verdict

The UK’s financial landscape is poised for a significant transformation. Moody’s and S&P are set to release their assessments of the nation’s credit rating on October 20th, with Fitch following suit on December 1st.

These impending evaluations will play a pivotal role in shaping the UK’s financial future.

(UK ratings, Fitch)


Conclusion

In conclusion, the UK’s escalating government debt crisis demands immediate attention. As this hierarchical presentation illustrates, the mounting debt, coupled with inflation-linked complications, has profound implications.

The nation’s credit rating, currently at risk, hinges on the impending assessments by rating agencies. Staying informed and prepared for potential developments in the UK’s financial stability is of utmost importance.


Disclaimer

Comments, news, research, analysis, price, and all information contained in the article only serve as general information for readers and do not suggest any advice. Ultima Markets has taken reasonable measures to provide up-to-date information, but cannot guarantee accuracy, and may modify without notice. Ultima Markets will not be responsible for any loss incurred due to the application of the information provided.