Important Information

This website is managed by Ultima Markets’ international entities, and it’s important to emphasise that they are not subject to regulation by the FCA in the UK. Therefore, you must understand that you will not have the FCA’s protection when investing through this website – for example:

  • You will not be guaranteed Negative Balance Protection
  • You will not be protected by FCA’s leverage restrictions
  • You will not have the right to settle disputes via the Financial Ombudsman Service (FOS)
  • You will not be protected by Financial Services Compensation Scheme (FSCS)
  • Any monies deposited will not be afforded the protection required under the FCA Client Assets Sourcebook. The level of protection for your funds will be determined by the regulations of the relevant local regulator.

Note: Ultima Markets is currently developing a dedicated website for UK clients and expects to onboard UK clients under FCA regulations in 2026.

If you would like to proceed and visit this website, you acknowledge and confirm the following:

  • 1.The website is owned by Ultima Markets’ international entities and not by Ultima Markets UK Ltd, which is regulated by the FCA.
  • 2.Ultima Markets Limited, or any of the Ultima Markets international entities, are neither based in the UK nor licensed by the FCA.
  • 3.You are accessing the website at your own initiative and have not been solicited by Ultima Markets Limited in any way.
  • 4.Investing through this website does not grant you the protections provided by the FCA.
  • 5.Should you choose to invest through this website or with any of the international Ultima Markets entities, you will be subject to the rules and regulations of the relevant international regulatory authorities, not the FCA.

Ultima Markets wants to make it clear that we are duly licensed and authorised to offer the services and financial derivative products listed on our website. Individuals accessing this website and registering a trading account do so entirely of their own volition and without prior solicitation.

By confirming your decision to proceed with entering the website, you hereby affirm that this decision was solely initiated by you, and no solicitation has been made by any Ultima Markets entity.

I confirm my intention to proceed and enter this website

FED’s Latest Move and November 2023’s ISM Manufacturing PMI


The Impact of FED’s Decision and ISM Manufacturing PMI in November 2023

In November 2023, the Federal Reserve (FED) once again held its rates unchanged, marking the second consecutive time for such a decision. Investors and financial experts alike anticipated and conjectured about this FED move.

In addition, the Manufacturing Purchasing Managers Index (PMI) for October was released by the Institute for Supply Management (ISM), providing insight into the status of the US manufacturing industry.


Key Takeaway: FED’s Inflation Concerns

The FED’s Response to Inflation

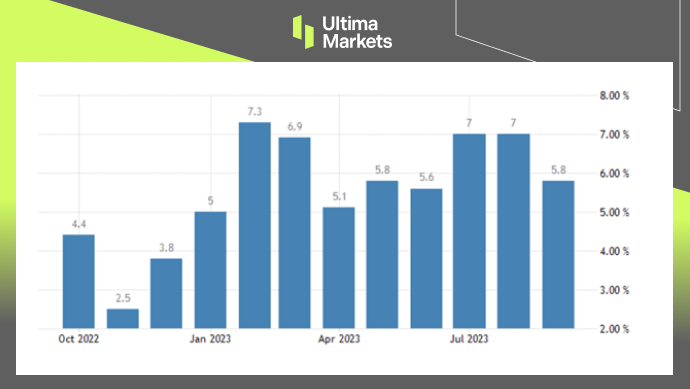
The foremost concern addressed by the FED was the persistence of high inflation. FED Chairman Jerome Powell emphasized that inflation had exceeded the FED’s long-term target of 2%. Specifically, the total Personal Consumption Expenditures (PCE) prices had surged by 3.4% over the 12 months ending in September.

Federal Funds Rate, FED by Ultima Markets MT4

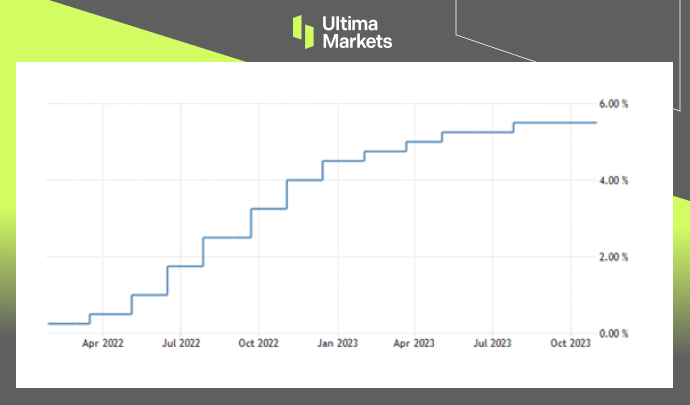
(Federal Funds Rate, FED)

Monetary Policy Consideration

Powell’s statement shed light on the FED’s approach to managing inflation. He articulated that any future rate hikes would be executed with great caution, considering factors such as the cumulative impact of prior rate adjustments, the time lag in the transmission of monetary policy effects, and the prevailing economic and financial market conditions.

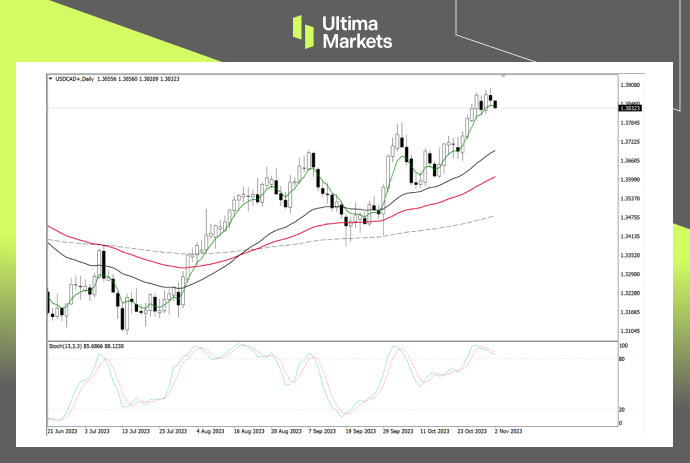
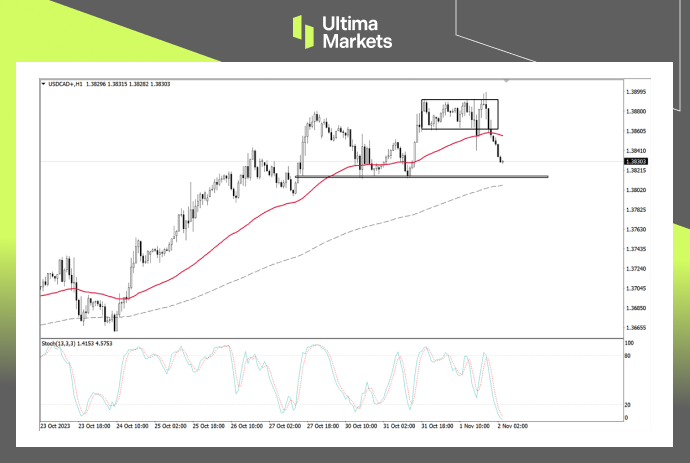
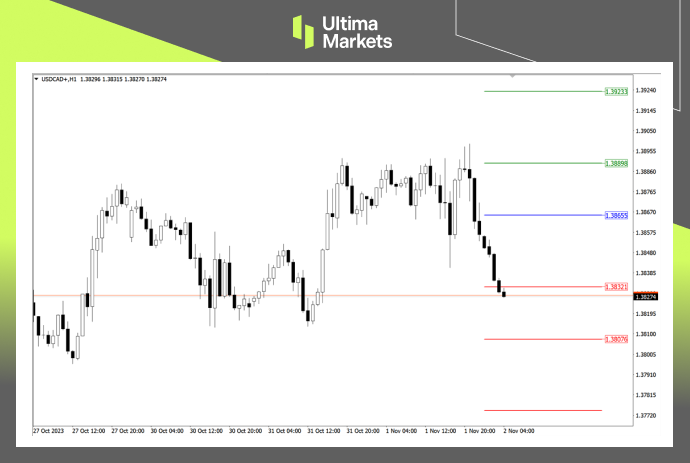
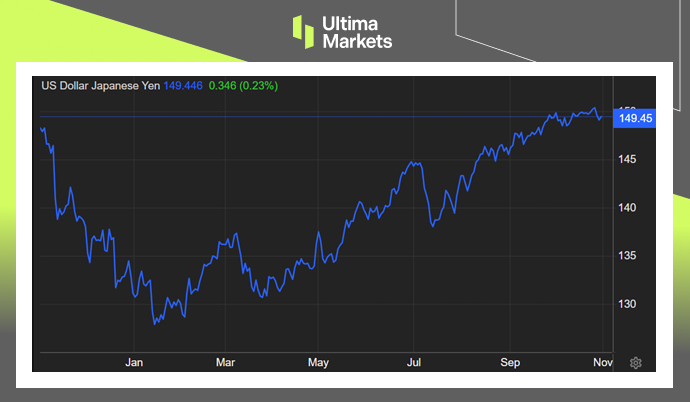
Market Impact: USD Index Decline

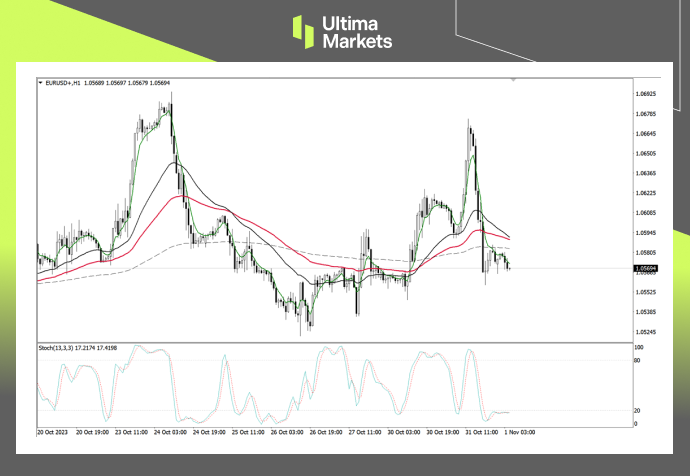
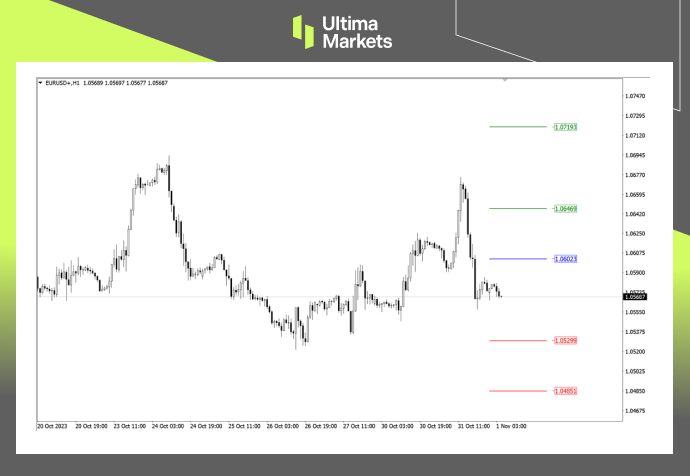
Following the FED’s announcement, the USD index (DXY) experienced a noticeable decline, moving from 106.66 to 106.35. This underscores the strong correlation between the FED’s monetary policy decisions and currency markets, making them of paramount importance to traders and investors.


Insights into ISM Manufacturing PMI for October 2023

The Escalating Contraction

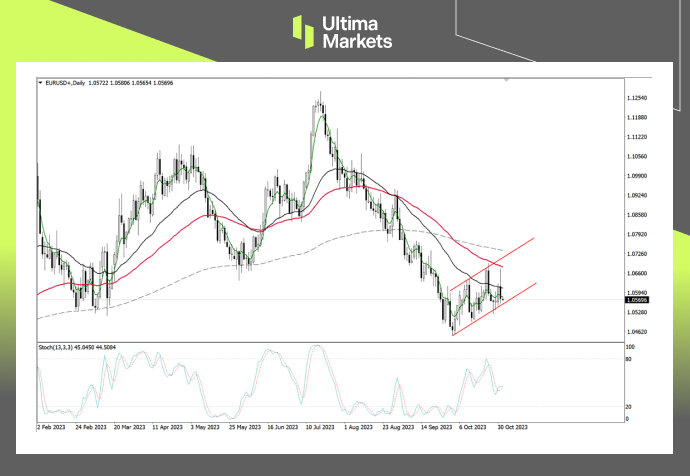
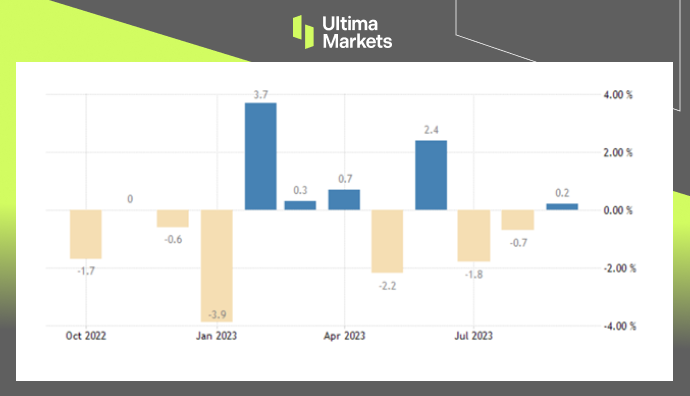
The ISM’s Manufacturing PMI data for October 2023 unveiled a worrisome trend. The U.S. manufacturing sector continued to contract, with the pace of contraction intensifying. The PMI declined by 2.3%, reaching 46.7%, in contrast to the 49% recorded in September, emphasizing the sector’s ongoing challenges.

Manufacturing Purchasing Managers Index PMI, ISM By Ultima Markets MT4

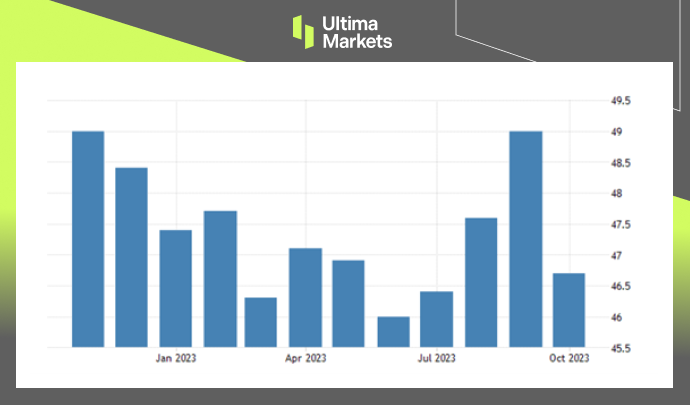
(Manufacturing Purchasing Managers Index PMI,ISM)

Decline in New Orders

A critical factor contributing to the sector’s struggles is the downturn in new orders. Firms are grappling with reduced demand for their products, which has a detrimental impact on production and overall growth.

Challenges in Export Orders

While there was a moderate rise in the new export orders index, it remained within contraction territory. This suggests that the international market is not providing the expected boost to U.S. manufacturers.

Backlogs of Orders: A Persistent Issue

The backlogs of orders index also saw a slight decline, maintaining its position within sharp contraction territory. This signifies that manufacturers are contending with the backlog of existing orders, which can have ripple effects on future production.


Bottom Line

In conclusion, the FED’s unwavering stance on interest rates and the ISM Manufacturing PMI for October 2023 offer essential insights into the state of the U.S. economy. Staying well-informed about these developments is vital for making sound financial decisions in a constantly evolving economic landscape.


Focus on USD/CAD Today – 2nd November 2023 


Comprehensive USD/CAD for November 2, 2023

In this comprehensive analysis, Ultima Markets brings you an insightful breakdown of the USD/CAD for 2nd November 2023. 


Key Takeaways 

  • Federal Reserve’s attitude: The interest rate decision of Federal Reserve did not change the policy interest rate as expected. Fed members have been working hard to balance the two risks. They do not want to raise interest rates too much and cause an unnecessary deep recession, nor do they want to accelerate inflation again or stabilize well above the 2% target. 
  • The Canadian dollar may be favored: The Canadian employment survey shows that the labor market continues to be tight and wages continue to rise significantly. The unexpectedly strong data raised the possibility of further interest rate hikes from the Bank of Canada, while the prospect of higher oil prices also increased the likelihood of a higher Canadian dollar. 

USD/CAD Technical Analysis 


USD/CAD Daily Chart Insights

USD/CAD Daily Chart Insights by Ultima Markets MT4
  • Stochastic Oscillator: After the indicator formed a short signal in the overbought area, it began to turn downward yesterday, suggesting that the exchange rate may begin to decline. 
  • Price Action: After the exchange rate fluctuated at a high level for four trading days, it closed as a small doji candle yesterday. If it finally closes the dark candle bar today, the market may adjust downward in the future. 
  • 5-day moving average: The 5-day moving average has supported the continuous upward trend. If the market closes below the 5-day moving average, the upward trend of the exchange rate will end in the short term. 

USD/CAD 1-hour Chart Analysis

USD/CAD 1-hour Chart Analysis by Ultima Markets MT4
  • Stochastic oscillator: The indicator is still in the oversold area, and there is no bull signal, suggesting that the current short forces have the upper hand and cannot easily choose to buy the bottom. 
  • Price Action: Since October 31st, it has fluctuated at high levels to form a rectangular range. After the market fell below the range, the red 65-period moving average failed to support the decline. The next target of the market is the black support line, which may also be the 200-period moving average. 

Ultima Markets MT4 Pivot Indicator

Ultima Markets MT4 Pivot Indicator for USD/CAD
  • According to the pivot indicator in Ultima Markets MT4, the central price of the day is established at 1.38655, 
  • Bullish Scenario: Bullish sentiment prevails above 1.38655, first target 1.38898, second target 1.39233; 
  • Bearish Outlook: In a bearish scenario below 1.38655, first target 1.38321, second target 1.38076. 

Conclusion 

The Surge of Bitcoin: A Phenomenal October Rally


The Bitcoin ETF Hype

In October, cryptocurrency prices increased significantly, especially for bitcoin. Bitcoin had its biggest monthly hike since January.

Investors were excited about the possibility that bitcoin exchange-traded funds (ETFs) may soon be approved in the United States. ETF offers easy and affordable access for the average investor as compared to investing in cryptocurrency itself or existing products. 


The Bitcoin ETF Revolution

Simplifying Crypto Investments

Bitcoin ETFs, once approved, have the power to reshape the way individuals engage with cryptocurrencies. They present a user-friendly and cost-effective means for the average investor to participate in the digital asset realm.

Unlike the traditional method of direct cryptocurrency investment, which can be complex and intimidating, Bitcoin ETFs provide a structured and approachable entry point.

Mainstream Legitimacy

The impending approval of Bitcoin ETFs heralds a new era of legitimacy for cryptocurrencies. These ETFs bridge the gap between traditional financial markets and the crypto space, bringing credibility to the forefront. With the backing of mainstream financial institutions, Bitcoin’s status as a viable investment asset is reinforced.


The Ripple Effect

Broad Market Growth for Bitcoin

The surge in Bitcoin’s price triggered a ripple effect throughout the cryptocurrency market. The CoinDesk Market Index (CMI), tracking various tokens, recorded an impressive 22% growth during October. This upswing signifies a prevailing bullish sentiment, injecting confidence into the crypto landscape.

Bitcoin Market Capitalization Soars

TradingView data reveals that the total market capitalization of all cryptocurrencies soared by nearly 19%, reaching a substantial $1.255 trillion. This surge represents the most significant increase in crypto wealth since January, underlining the market’s resilience and growth potential.

Bitcoin/US Dollart One-month Chart By Ultima Markets MT4

(BTCUSD One-month Chart)


Bitcoin’s Outstanding Performance

Bitcoin’s Ascendancy

Bitcoin (BTC), the pioneer of cryptocurrencies, outperformed its peers during this remarkable rally. BTC advanced by more than 27%, achieving a 17-month high of $35,000. This surge followed a period during which it traded around $27,000 in the early weeks of October. Currently, Bitcoin maintains its position above $34,000, as investors eagerly await the Federal Reserve’s interest rate decision.

Confidence in Bitcoin

Bitcoin’s impressive performance during this surge underscores its appeal to investors worldwide. Its stability above $34,000 signals growing confidence in Bitcoin as a long-term store of value and investment asset.


Conclusion

The surge of Bitcoin in October 2023 was nothing short of phenomenal, fueled by the prospects of Bitcoin ETF approval in the United States. This surge not only transformed Bitcoin but had a cascading effect on the broader cryptocurrency market. It showcased resilience, promise, and Bitcoin’s enduring position as a prominent player in the digital asset landscape.

The cryptocurrency market is still changing as time goes on. The forthcoming introduction of Bitcoin ETFs into traditional financial markets marks a significant turning point, providing investors of all stripes with accessibility, legitimacy, and a wide range of investment options.


Focus on EUR/USD Today – 1st November 2023 


Comprehensive EUR/USD for November 1, 2023

In this comprehensive analysis, Ultima Markets brings you an insightful breakdown of the EUR/USD for 1st November 2023. 


Key Takeaways 

  • ECB monetary policy: The latest interest rate decision of the European Central Bank has chosen to suspend interest rate hikes, it is the first time since July 2022.  As expectations for the suspension of interest rate hikes have been generally reflected in the markets, short-term volatility in Europe and the United States will be modest.
  • Economic outlook for the Eurozone: The manufacturing industry in the Eurozone continues to decline, the service industry is weak, demand is sluggish, and the economy may remain fragile in the coming months. 
  • The US dollar may be strong: The market is betting that the interest rate decision announced by the Federal Reserve early Thursday may not raise interest rates, but may maintain hawkish rhetoric. The yield of two-year US bonds, which are more sensitive to monetary policy, rose to 5.08% 

EUR/USD Technical Analysis 


EUR/USD Daily Chart Insights

EUR/USD Daily Chart Insights By Ultima Markets MT4
  • Stochastic Oscillator: The indicator’s fast line and slow line were entangled yesterday, and the market entered a oscillating rhythm again. Wait for the indicator to show long or short signals. 
  • Price Action: After the exchange rate returns to the moving average, a pin bar appears, indicating that short sellers have the upper hand, but short sellers still need to wait for the market to fall below the previous low price of 1.0520. 
  • Flag-shaped consolidation structure: The exchange rate has fluctuated upward since October 4, and the overall price has shown a flag-shaped shock range. The 65 moving average successfully suppressed the further rebound of the exchange rate. Next, we will pay attention to whether today’s market can fall below the range. If the range is still effectively supported, the market will rebound and rise again. Otherwise, short opportunities will come. 

EUR/USD 1-hour Chart Analysis

EUR/USD 1-hour Chart Analysis By Ultima Markets MT4
  • Stochastic Oscillator: The fast line is about to cross the slow line, suggesting that the exchange rate is about to fall into consolidation in the short term. 
  • Moving average combination: The exchange rate fell below the 200-period moving average. Currently, the 33-period moving average and the 65-period moving average have not yet crossed the 200-period moving average. Theoretically, when the fast line crosses the slow line, the market may return to the short-term moving average group. 

Ultima Markets MT4 Pivot Indicator

Ultima Markets MT4 Pivot Indicator for EUR/USD
  • According to the pivot indicator in Ultima Markets MT4, the central price of the day is established at 1.06023, 
  • Bullish Scenario: Bullish sentiment prevails above 1.06023, first target 1.06469, second target 1.07193; 
  • Bearish Outlook: In a bearish scenario below 1.06023, first target 1.05299, second target 1.04851. 

Conclusion 


Ultima Markets Index Dividend Adjustment Notice

When you are trading in Contracts for Difference (CFDs) on spot stock indices, if a component of the underlying stock index pays a dividend/dividend (payout) to its shareholders, your trading account will be adjusted ex-dividend at 00:00 server time on the same day, and the corresponding gain or expense will occur depending on the position you are holding and will be reflected in the account history.

• The above data are expressed in the base currency of each index.

• According to market practice, the actual execution data may change, please refer to MT4 software for details.

When the stock index goes ex-dividend, the dividend will be adjusted in the form of fund deduction.

You can view the fund deduction record with the following annotation “Div & stock index name & net lot” in the account history,It is the dividend adjustment. The long lot is calculated as a “positive value”, and the short lot is calculated as a “negative value”. The sum of the two is the “net lot”.

An example is as follows.

If you trade more than 5 lots of DJ30, you can view the “Div & DJ30 & 5” dividend adjustment record in the form of balance in the account history; View the “Div & DJ30 & -5” dividend adjustment records in the form of balance.

We recommend that you carefully evaluate your current positions and consider whether to hold it overnight.

If you have any questions or require assistance, please do not hesitate to contact [email protected]

Focus on GBP/NZD Today – 31st October 2023


Comprehensive GBP/NZD for October 31, 2023

In this comprehensive analysis, Ultima Markets brings you an insightful breakdown of the GBP/NZD for 31st October 2023. 


Key Takeaways 

  • BOE Monetary Policy: The Bank of England will announce its latest interest rate decision this Thursday. The current economy in the UK does not support another interest rate hike, and the market is paying attention to how the Bank of England views the future economy. If any dovish signal is released, the pound will have a huge depreciation trend. 
  • New Zealand Monetary Policy: Currently, New Zealand’s overall CPI is lower than the central bank’s expectations, and the market expects an interest rate hike from November this year to February next year. Any event that stimulates an interest rate hike this year will cause the New Zealand dollar to appreciate. 

GBP/NZD Technical Analysis 


GBP/NZD Daily Chart Insights

GBP/NZD Daily Chart Insights By Ultima Markets MT4
  • Stochastic Oscillator: The indicator shows a short signal in the overbought area, suggesting that the market is about to fall into a correction, and may even reverse downward. 
  • Moving average combination: After the exchange rate broke through the 33-day moving average and the 65-day moving average , a retracement structure appeared, and it is currently consolidating sideways above the two moving averages. Coupled with the stochastic oscillator, there is a greater probability that the market will continue to rise after completing the consolidation. 
  • Price Action: After the exchange rate completed the W-bottom price action on October 13, the neckline position was an important support price. Although the market is currently consolidating above the moving average, it cannot be ruled out that the market will further fall back to the neckline price. 

GBP/NZD 4-hour Chart Analysis

GBP/NZD 4-hour Chart Analysis By Ultima Markets MT4
  • Moving average combination: The exchange rate is supported by the 65-period moving average and the 200-period moving average, showing a convergent triangle structure in the short term. 
  • Fibonacci retracement level: If the moving average cannot continue to support the exchange rate, the next target will be the 38.2% Fibonacci retracement level. 
  • Channel line support position: The second target of the market correction is the upper edge of the upward channel below, which is a potential strong support price. If it returns into the channel again, the market will clearly reverse and move downward. 

Ultima Markets MT4 Pivot Indicator

Ultima Markets MT4 Pivot Indicator for GBP/NZD
  • According to the pivot indicator in Ultima Markets MT4, the central price of the day is established at 2.08135, 
  • Bullish Scenario: Bullish sentiment prevails above 2.08135, first target 2.08785, second target 2.09334; 
  • Bearish Outlook: In a bearish scenario below  2.08135, first target 2.07590, second target 2.06927. 

Conclusion 


Ultima Markets Holiday Trading Hours Adjustment Notice

The trading sessions of some products will be adjusted due to international holidays. Please refer to the following details:
Holiday Date Adjustments (Product / Actions)
All Saints’ Day 2023.11.01 Market Closed USDCLP
All Souls Day 2023.11.02 Market Closed FX / USDBRL
Indices / BVSPX
All Saints’ Day 2023.11.06 Market Closed USDCOP
Independence of Cartagena 2023.11.13 Market Closed USDCOP
Proclamation of the Republic 2023.11.15 Market Closed FX / USDBRL
Indices / BVSPX
Thanks giving 2023.11.23 Market Closed FX / USDBRL, USDCLP, USDCOP
Commodities / Cocoa, Coffee, Cotton, OJ,
Soybean, Sugar, Wheat
US Shares
18:30 Early Close VIX
20:00 Early Close Indices / DJ30, DJ30ft, SP500, SP500ft,
NAS100, NAS100ft, US2000,
Nikkei225, JPN225ft
Metal / XPDUSD, XPTUSD
Bonds / TY
20:15 Early Close USOUSD
20:30 Early Close UKOUSD, UKOUSDft, Gasoil
21:30 Early Close Metals / XAUUSD (GOLD),
XAGUSD (SILVER)
Commodities / USOUSD, CL-OIL,
Copper, GAS,NG
23:00 Early Close UK100, UK100ft, GER40, GER40ft,
EU50,FRA40, SPI200
Thanks giving 2023.11.24 03:00 Late Open UKOUSDft
15:00 Late Open
20:30 Early Close
Cotton
16:30 Late Open
20:05 Early Close
Soybean, Wheat
20:00 Early Close Metal / XPDUSD, XPTUSD
US Shares
20:15 Early Close Indices / DJ30, DJ30ft, SP500, SP500ft,
NAS100, NAS100ft, US2000, USDX, VIX
Nikkei225, JPN225ft,
Bonds / TY
20:30 Early Close USOUSD, OJ
20:45 Early Close Metals / XAUUSD (GOLD),
XAGUSD (SILVER)
Commodities / CL-OIL, Copper, GAS,NG
21:00 Early Close UKOUSD, Gasoil
23:00 Early Close UK100, UK100ft, EU50, FRA40, SPI200

Friendly Reminder

  • • The mentioned times are based on DST system time GMT+2.
  • • Liquidity providers might adjust the trading sessions base on the dynamic nature of market conditions. The up-to-date execution data should be subject to information on the MetaTrader software/application.
    If you have any questions or require assistance, please do not hesitate to contact [email protected]
.holiday_product .inner .sheet tr:nth-child(10) td:nth-child(1){padding:10px}

Yen’s Surge and Market Dynamics in October 2023


Japan’s Retail and Industrial Production Data Mixed, Yen Appreciated on Expectations of Monetary Policy Change

In the ever-evolving sphere of global economics, Japan’s financial landscape remains a focal point of interest. As we navigate through the intricacies of Japan’s retail and industrial sectors, we are presented with mixed data that fuels discussions and influences global market dynamics.

In this comprehensive analysis, we explore the recent surge of the Japanese Yen, the resilience of the retail industry, and the complexities of industrial production in Japan.


Japanese Yen Rose on YCC Anticipation

The Japanese yen appreciated against the U.S. dollar, reaching its highest level in nearly 3 weeks. The uplift was brought by the Japanese media reporting that the BOJ may change the monetary policies on Tuesday. 


Understanding the BOJ’s Yield Curve Control

The BOJ adapts the yield curve control in an attempt to influence interest rates. The report said the central bank may allow long-term interest rates in Japan to rise. Specifically, it might let interest rates on 10-year government bonds go above 1%.

Last time, BOJ tweaked its yield curve control in July from 0.5% to 1%. Higher interest rates tend to make a currency more valuable to investors. As a result, the possibility of Japan raising rates helped make the yen stronger compared to the dollar. 

USD/JPY One-year Chart

(USD/JPY One-year Chart) 


Japanese Retail Sales Recovering from Pandemic 

Retail sales in Japan rose 5.8%YoY in September. This is a slower increase than the 7% jump in sales seen in both July and August. The September gain was about in line with forecasts expecting a 5.9% rise. Still, it marked the 19th month in a row that retail sales have grown in Japan. This shows consumer spending continues to recover after dropping during the pandemic.  

Japan Retail Sales, METI Japan

(Japan Retail Sales, METI Japan) 


Insights into Consumer Spending Recovery

This continuous growth in retail sales reflects Japan’s steadfast commitment to economic recovery, particularly in the face of the challenges posed by the global pandemic.

It underscores the unwavering nature of consumer spending, even after a significant drop during the early stages of the pandemic.

The retail sector’s ability to adapt and thrive in challenging circumstances showcases Japan’s economic resilience.


Japan’s Industrial Production Fell Short of Expectations

In September, Japan’s industrial production experienced a modest growth of 0.2% compared to the previous month. However, this figure fell short of market expectations, which had predicted a 2.5% increase.

The September result represents a turnaround from the 0.7% decline that was recorded in the previous month. Importantly, this marks the first positive change in industrial output since June.


Factors Influencing Industrial Output

The increase in production was primarily driven by notable improvements in the manufacturing of motor vehicles, which saw a substantial increase of 6.0% compared to a decline of 3.9% in August.

Additionally, there was growth in the production of general-purpose and business-oriented machinery, which showed a 2.6% increase compared to a 1.0% decrease in the preceding month.

However, when considering the annual comparison, industrial output in September exhibited a decline of 4.6%. This follows a 4.4% drop in August and signifies the third consecutive month of contraction in industrial production. 

Japan Industrial Production, METI Japan

(Japan Industrial Production, METI Japan) 


Conclusion

In conclusion, this comprehensive analysis deciphers Japan’s economic landscape, characterized by the Japanese Yen’s notable surge, the resilience of the retail sector, and the complexities surrounding industrial production.

These facets collectively shape Japan’s economic future, emphasizing the crucial role of policy adjustments and market dynamics in determining the nation’s economic well-being. Stay tuned for further insights into the ever-evolving economic terrain of Japan.


Ultima Markets Index Dividend Adjustment Notice

When you are trading in Contracts for Difference (CFDs) on spot stock indices, if a component of the underlying stock index pays a dividend/dividend (payout) to its shareholders, your trading account will be adjusted ex-dividend at 00:00 server time on the same day, and the corresponding gain or expense will occur depending on the position you are holding and will be reflected in the account history.

• The above data are expressed in the base currency of each index.

• According to market practice, the actual execution data may change, please refer to MT4 software for details.

When the stock index goes ex-dividend, the dividend will be adjusted in the form of fund deduction.

You can view the fund deduction record with the following annotation “Div & stock index name & net lot” in the account history,It is the dividend adjustment. The long lot is calculated as a “positive value”, and the short lot is calculated as a “negative value”. The sum of the two is the “net lot”.

An example is as follows.

If you trade more than 5 lots of DJ30, you can view the “Div & DJ30 & 5” dividend adjustment record in the form of balance in the account history; View the “Div & DJ30 & -5” dividend adjustment records in the form of balance.

We recommend that you carefully evaluate your current positions and consider whether to hold it overnight.

If you have any questions or require assistance, please do not hesitate to contact [email protected]