Important Information

You are visiting the website that is operated by Ultima Markets Ltd, a licensed investment firm by the Financial Services Commission “FSC” of Mauritius, under license number GB 23201593. Please be advised that Ultima Markets Ltd does not have legal entities in the European Union.

If you wish to open an account in an EU investment firm and protected by EU laws, you will be redirected to Ultima Markets Cyprus Ltd (the “CIF”), a Cyprus investment firm duly licensed and regulated by the Cyprus Securities and Exchange Commission with license number 426/23.

Strategic Hedging Fuels Surge in Precious Metals Trading


Gold Surges Past $2,000 Driven by Geopolitical Tensions

Israeli forces have begun their largest ground attack in Gaza so far in the war with Hamas, despite ongoing diplomatic efforts to delay an expected full ground invasion.

Fueled by hedge buying, Gold raised above $2,000 an ounce and marked the third straight weekly gain.

Gold is trading within a very steep ascending channel, which highlights not only the strength of the current rally but also the need for consolidation. 
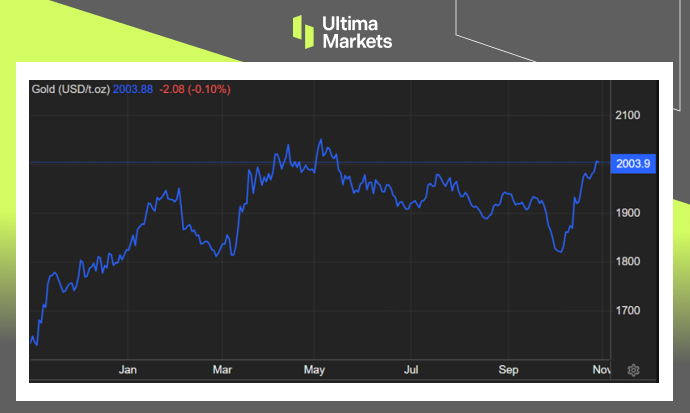
Gold Price USD/Ounce

(Gold Price USD/Ounce) 


The Gold Rally: A Closer Look

The Middle East’s developing geopolitical events, particularly the ongoing conflict between Israeli forces and Hamas, are primarily responsible for the recent spike in gold prices.

Israeli forces have launched their most extensive ground attack in Gaza to date, despite continuous diplomatic efforts to avert a full-scale ground invasion.

This significant escalation of hostilities has triggered a sharp increase in the demand for gold, predominantly driven by a surge in hedge buying.


Geopolitical Tensions: The Catalyst

The heightened geopolitical tensions have underscored the importance of gold as a safe-haven asset. During times of uncertainty and conflict, investors and institutions alike turn to gold as a reliable store of value.

The surge in gold prices reflects not only the current rally’s strength but also the market’s demand for a stable and secure asset amidst turmoil.


A Steep Ascending Channel

Gold’s impressive ascent is further emphasized by its trading within a steep ascending channel. This upward price trend signifies not only the robustness of the current gold rally but also the necessity for consolidation.

The ascending channel illustrates the market’s optimism regarding gold’s potential and its sustained upward trajectory.


Silver Softened, After Hitting a High 

On the other hand, silver, a valuable metal often sought as a safe investment during uncertain times, received ongoing support due to the Middle East conflict.

Additionally, the prospects for increased industrial usage of silver were strengthened by additional stimulus measures implemented in China.

However, silver prices didn’t sustain strength, falling below $23.3 per ounce, following a recent peak on October 20th.  
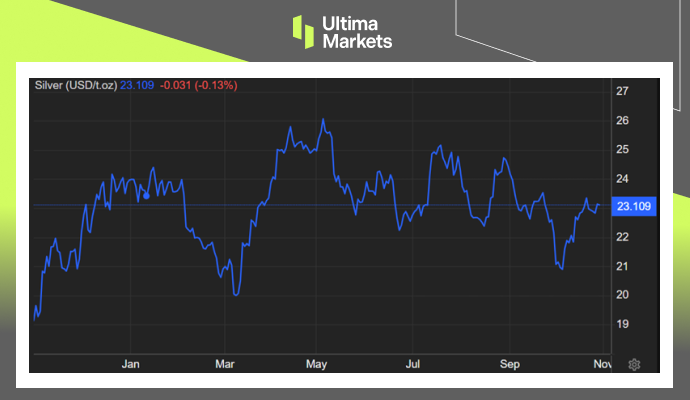
Silver Price USD/Ounce

(Silver Price USD/Ounce) 


Conclusion

The surge in gold prices, driven by geopolitical tensions in the Middle East, marks a pivotal moment in the precious metals market.

Gold’s status as a safe-haven asset has been reaffirmed, and its upward trajectory within a steep ascending channel suggests a continued bullish sentiment.

While silver also responded positively to global turmoil, its recent price decline highlights the complex dynamics within the precious metals market.

Stay tuned for more updates as we navigate these exciting developments in the world of precious metals.


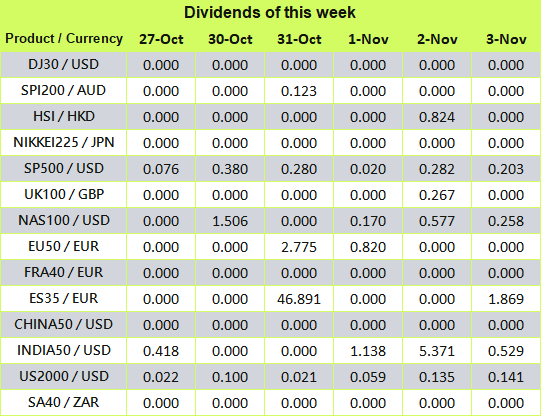
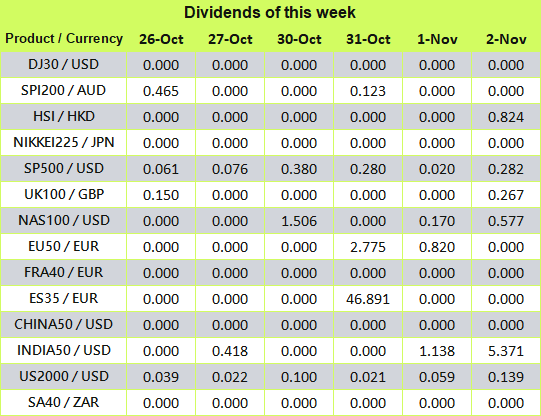
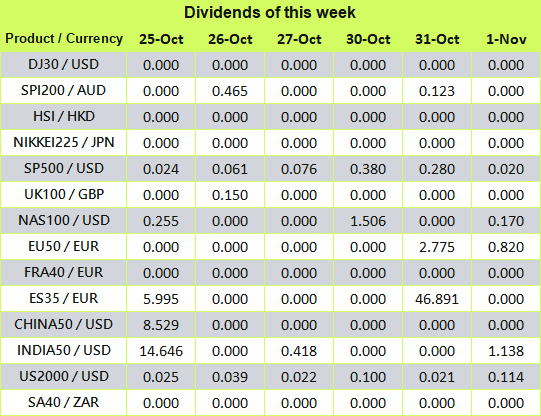
Ultima Markets Index Dividend Adjustment Notice

When you are trading in Contracts for Difference (CFDs) on spot stock indices, if a component of the underlying stock index pays a dividend/dividend (payout) to its shareholders, your trading account will be adjusted ex-dividend at 00:00 server time on the same day, and the corresponding gain or expense will occur depending on the position you are holding and will be reflected in the account history.

• The above data are expressed in the base currency of each index.

• According to market practice, the actual execution data may change, please refer to MT4 software for details.

When the stock index goes ex-dividend, the dividend will be adjusted in the form of fund deduction.

You can view the fund deduction record with the following annotation “Div & stock index name & net lot” in the account history,It is the dividend adjustment. The long lot is calculated as a “positive value”, and the short lot is calculated as a “negative value”. The sum of the two is the “net lot”.

An example is as follows.

If you trade more than 5 lots of DJ30, you can view the “Div & DJ30 & 5” dividend adjustment record in the form of balance in the account history; View the “Div & DJ30 & -5” dividend adjustment records in the form of balance.

We recommend that you carefully evaluate your current positions and consider whether to hold it overnight.

If you have any questions or require assistance, please do not hesitate to contact [email protected]

US GDP and Durable Goods Came in With Terrific Results


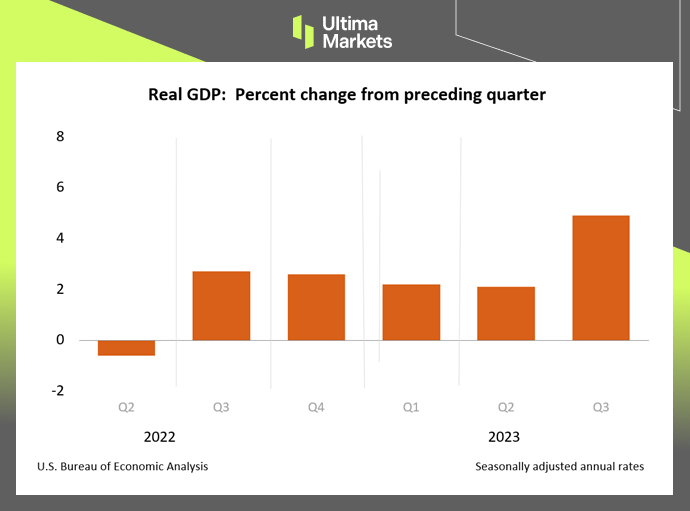
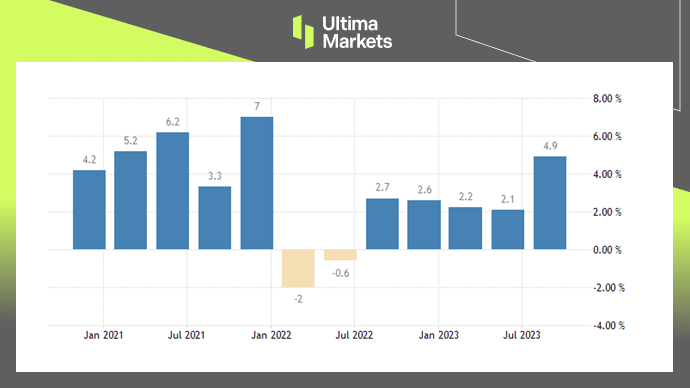
U.S. GDP Up 4.9% in 3Q, Fastest Growth in Past Two Years 

The U.S. Department of Commerce reported that U.S. GDP grew by 4.9% in the third quarter, exceeding the 2.1% growth in the second quarter and economists’ expectations. Strong consumer spending contributed to the growth drive.  


Consumer Spending Takes Center Stage

Consumer spending experienced a significant increase of 4%, marking the highest growth rate since the fourth quarter of 2021. The uptick surpassed the modest 0.8% increase seen in the second quarter of 2023.  

U.S. GDP,U.S. Department of Commerce

(U.S. GDP,U.S. Department of Commerce)


U.S. Durable Goods Orders lifted 4.7% MoM in September, Exceeding Expectations 

After contracting by 0.1% in August, new orders for manufactured durable goods in the US increased by 4.7% month over month in September 2023, well above the 1.7% increase that the market had anticipated.  


Transportation Equipment Leads the Charge

The standout feature in the durable goods orders report is the resurgence of demand for transportation equipment. Orders for transportation equipment witnessed a remarkable increase of 12.7% in September, a stark contrast to the 1.1% decrease observed in August. This upswing is largely attributed to the heightened demand for civilian aircraft.

U.S. Durable Goods Orders, U.S. Census Bureau

(U.S. Durable Goods Orders, U.S. Census Bureau)


Conclusion

In summary, the most recent U.S. GDP and Durable Goods reports for the third quarter of 2023 have portrayed a bright and hopeful image of the nation’s economic well-being. Powered by vigorous consumer spending propelling GDP growth and an enduring demand for durable goods, the future appears promising.

These impressive outcomes underscore that the U.S. economy is following a robust trajectory, laying the groundwork for potential prosperity in the upcoming months.

As we persist in vigilantly tracking economic developments, it becomes imperative to remain well-informed and adaptable in the face of this ever-evolving landscape.

This approach equips us to make sound, well-considered choices and seize opportunities within the dynamic economic environment we navigate.


Focus on Brent Oil Today – 27th OCT 2023 


Comprehensive Brent Oil for October 27, 2023

In this comprehensive analysis, Ultima Markets brings you an insightful breakdown of the Brent Oil (UKOUSD) for 27th October 2023. 


Key Takeaways 

  • The Israeli-Palestinian conflict affects oil prices: Israel agreed to postpone its ground attack on Gaza this week, and crude oil price experienced a huge short-term correction, suggesting that risk sentiment is a key factor supporting current oil prices. If the conflict intensifies, oil prices will continue to rise. 
  • Geopolitical risks remain: The U.S. Department of Defense said that U.S. President Joe Biden had ordered strikes against Iran’s Islamic Revolutionary Guard Corps and two facilities used by Iran-backed groups in Syria. Oil prices rebounded in the short term. 

Brent Oil Technical Analysis 


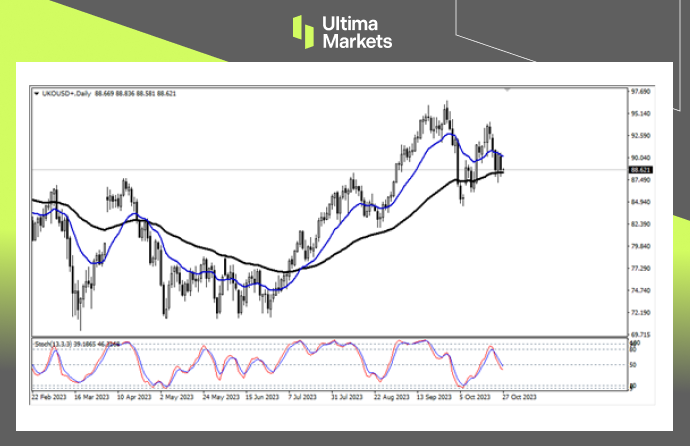
Brent Oil Daily Chart Insights

Brent Oil Daily Chart Insights by Ultima Markets MT4
  • Stochastic Oscillator: The fast line crosses the slow line, and the indicator falls to the 50 mid-line, suggesting that the market price will do a correction next. 
  • Price Action: Oil prices showed a bearish engulfing Pattern, suggesting that the market may decline further. 
  • Moving average group: The blue 17-day moving average and the black 65-day moving average form a consolidation range. The oil price has been moved in this price range for three consecutive days. Whether it can be bearish or bullish depends on the market price direction.  

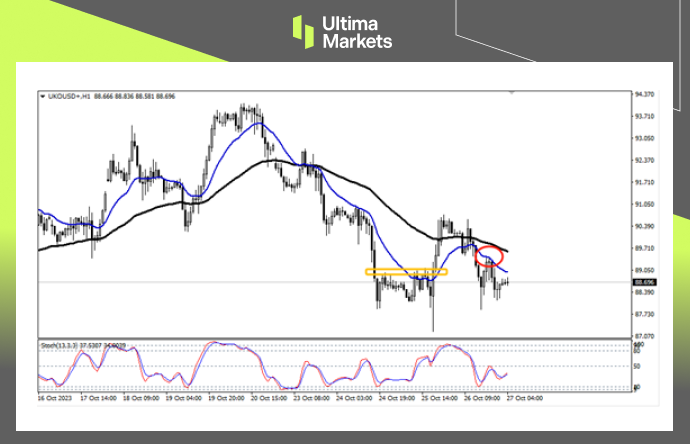
Brent Oil 1-Hour Chart Analysis

Brent Oil 1-Hour Chart Analysis by Ultima Markets MT4
  • Price Action: The direction of oil price is unclear. After oil prices rose above the yellow suppression price, the previous downward trend was destroyed, and the overall trend either reversed upward or experienced a longer-term shock adjustment. 
  • 17-period moving average: The market price fell below the moving average again. Yesterday, there was even a retracement of the 17-period moving average (red position), which implies that if the market falls below 87.876, the price will fall again. Otherwise, if it breaks through the red rebound area, the oil price will go upwards. 

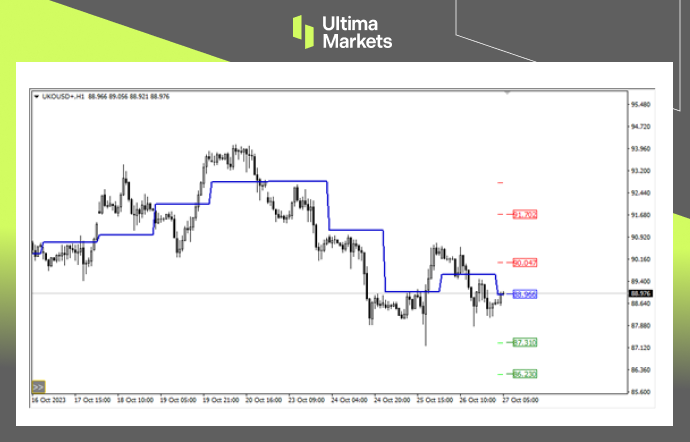
Ultima Markets MT4 Pivot Indicator

Ultima Markets MT4 Pivot Indicator for Brent Oil
  • According to the pivot indicator in Ultima Markets MT4, the central price of the day is established at 88.966, 
  • Bullish Scenario: Bullish sentiment prevails above 88.966, first target is 90.047, second target is 91.702. 
  • Bearish Outlook: In a bearish scenario below 88.966, first target 87.310, second target 86.230. 

Conclusion


Ultima Markets Index Dividend Adjustment Notice

When you are trading in Contracts for Difference (CFDs) on spot stock indices, if a component of the underlying stock index pays a dividend/dividend (payout) to its shareholders, your trading account will be adjusted ex-dividend at 00:00 server time on the same day, and the corresponding gain or expense will occur depending on the position you are holding and will be reflected in the account history.

• The above data are expressed in the base currency of each index.

• According to market practice, the actual execution data may change, please refer to MT4 software for details.

When the stock index goes ex-dividend, the dividend will be adjusted in the form of fund deduction.

You can view the fund deduction record with the following annotation “Div & stock index name & net lot” in the account history,It is the dividend adjustment. The long lot is calculated as a “positive value”, and the short lot is calculated as a “negative value”. The sum of the two is the “net lot”.

An example is as follows.

If you trade more than 5 lots of DJ30, you can view the “Div & DJ30 & 5” dividend adjustment record in the form of balance in the account history; View the “Div & DJ30 & -5” dividend adjustment records in the form of balance.

We recommend that you carefully evaluate your current positions and consider whether to hold it overnight.

If you have any questions or require assistance, please do not hesitate to contact [email protected]

Decipher Canada’s Inflation and the BOC’s Powerful Strategy


Understanding Canada’s Inflation Control and the BOC’s Monetary Policy

Within the intricate realm of economics, grasping the nuances of inflation control stands as a paramount endeavor. This article embarks on an exploration of Canada’s adept strategies for effectively managing inflation, while shedding light on the rationale behind the Bank of Canada’s (BOC) choice to uphold a 5% interest rate during its pivotal October 2023 meeting.


BOC Keeps Policy Rates Steady at 5%

In the world of economics, central banks like the BOC use interest rates as a critical tool to influence economic conditions.

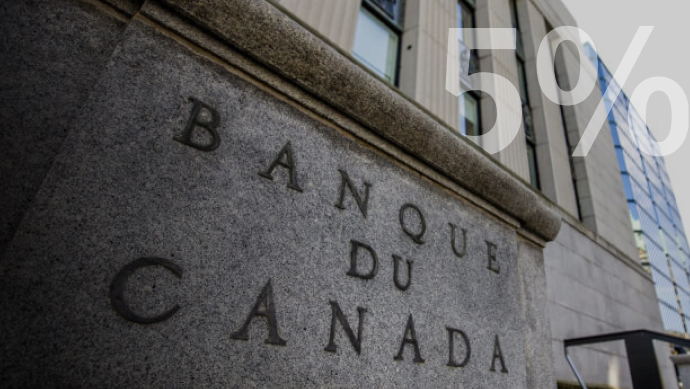
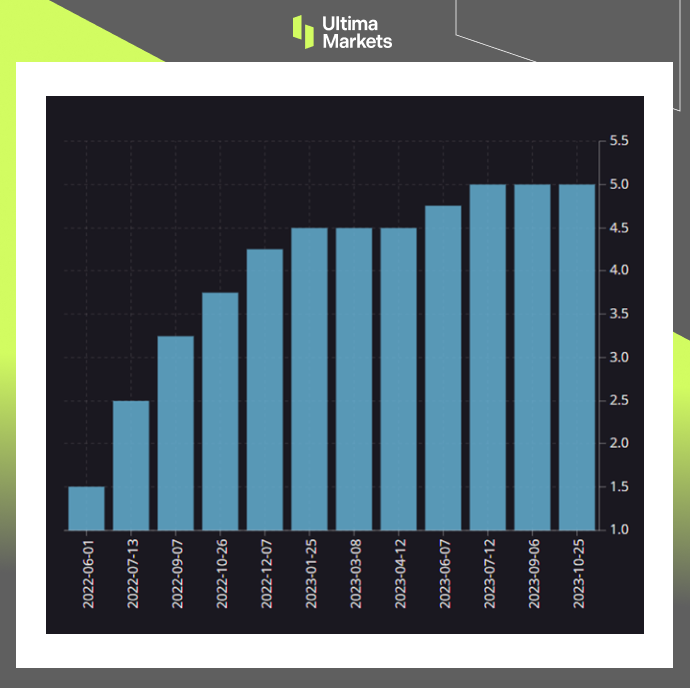
During its October meeting, the BOC chose to maintain the overnight rate at 5%. This decision has far-reaching implications, and to understand them, we need to explore the BOC’s broader monetary strategy.

(Policy interest rate, Bank Of Canada) 

(Policy interest rate, BOC) 


The Path to Stability: BOC’s Quantitative Tightening Policies

Quantitative tightening policies are at the forefront of the BOC’s monetary strategy. These policies encompass a series of actions aimed at tightening the money supply and controlling inflation. They are pivotal in ensuring economic stability and facilitating future growth.


What Are Quantitative Tightening Policies?

Quantitative tightening policies involve reducing the money supply by selling government bonds or other assets. By doing so, the BOC can absorb excess liquidity in the market, which, in turn, puts upward pressure on interest rates.


Understanding Canada’s Inflation Control

A pivotal metric under the constant scrutiny of the BOC is the Consumer Price Index (CPI). The CPI serves as a barometer of inflation, capturing the evolving costs of a diversified basket of goods and services over time. In recent months, Canada’s CPI has demonstrated a degree of volatility, warranting close attention.


Canada Inflation Levels Getting Under Control 

  • In June, the CPI was at 2.8%.
  • August saw a sharp increase, with the CPI reaching 4.0%.
  • September reported a CPI of 3.8%.

Bank Of Canada’s Projections

The BOC’s latest projections provide valuable insights into the future of inflation in Canada:-

Short-Term Outlook

  • The BOC’s projections suggest that the CPI is poised to maintain an average of approximately 3.5% until the middle of the upcoming year.
  • Short-term inflation trends are primarily steered by the influence of energy prices and the enduring presence of core inflation factors.

Long-Term Goals

  • Post-mid next year, the BOC projects a gradual decrease in inflation.
  • The ultimate goal is to reach a 2% inflation rate by 2025, signifying a more stable economic environment.

Conclusion

Canada’s economic panorama is intricately intertwined with the monetary policy choices of the BOC and its strategies for inflation management.

Vigilantly monitoring these evolutions empowers individuals and enterprises to make judicious financial decisions, adeptly traverse the economic terrain, and play a role in upholding the nation’s economic equilibrium.

Grasping the BOC’s position on interest rates and inflation control is of paramount importance for anyone with a stake in the Canadian economy, ensuring they remain well-informed and well-prepared for the challenges and opportunities that lie on the horizon.


Focus on EUR/USD Today – 26th October 2023 


Comprehensive EUR/USD for October 26, 2023

In this comprehensive analysis, Ultima Markets brings you an insightful breakdown of the EUR/USD for 26th October 2023. 


Key Takeaways 

  • ECB will not raise interest rates: Today the European Central Bank announced its latest interest rate decision. In September, the ECB unexpectedly raised interest rates for the tenth consecutive time. But then it was hinted that this round of interest rate hikes is coming to an end and the ECB may not raise interest rates for the rest of this year. The market will focus on whether the ECB has additional forward guidance. 
  • Euro depends on USD: Since the European Central Bank will “almost certainly” keep interest rates unchanged, the euro is more likely to be driven by the economy of the US. Tonight, the United States will announce the number of initial jobless claims last week and PCE data for the third quarter. 

EUR/USD Technical Analysis 


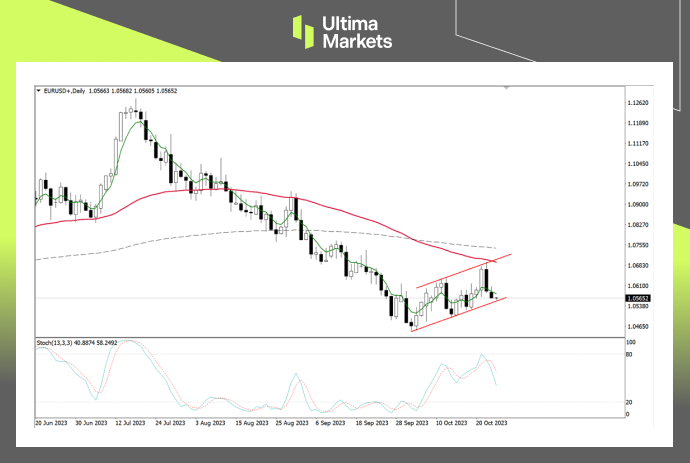
EUR/USD Daily Chart Insights

EUR/USD Daily Chart Insights by Ultima Markets MT4
  • Stochastic Oscillator: The fast line of the indicator crossed below the slow line yesterday, suggesting that a bearish trend in the market is coming. 
  • Price action: The exchange rate showed a bearish price action on Tuesday, and then the candle bar pulled back to the 5-day moving average and fell below Tuesday’s low, suggesting that bears have the upper hand. 
  • Flag-shaped consolidation structure: The exchange rate has fluctuated upward since October 4, and the overall price has shown a flag-shaped range. Next, we will pay attention to whether price can fall below the range today. If the range is still effectively supported, the market will rebound and rise again. Otherwise, short opportunities will come. 

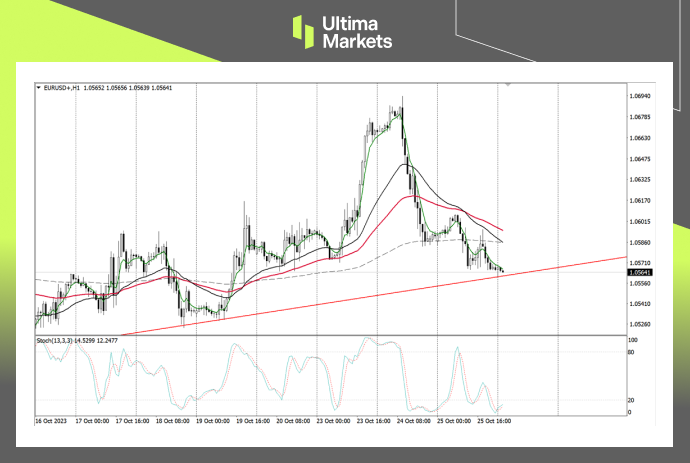
EUR/USD 1-hour Chart Analysis

EUR/USD 1-hour Chart Analysis by Ultima Markets MT4
  • Stochastic Oscillator: The fast line is about to cross the slow line, suggesting that the exchange rate is about to fall into consolidation in the short term. 
  • Moving average group: The exchange rate fell below the 200-period moving average. Currently, the 33-period moving average and the 65-period moving average have not yet crossed the 200-period moving average. Theoretically, when the fast line crosses the slow line, the market price may pull back to the short-term moving average group. 

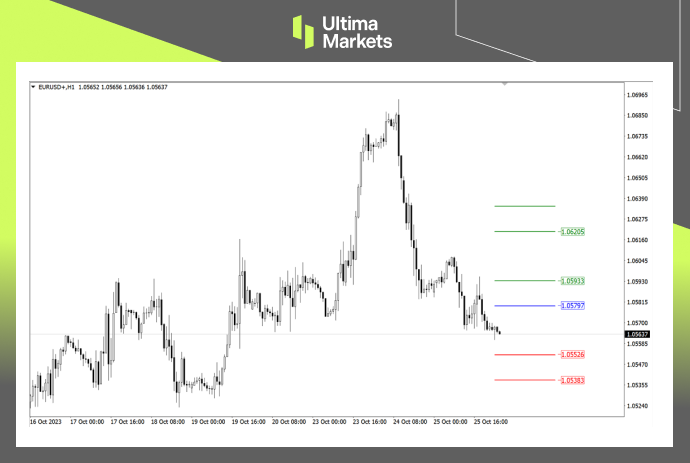
Ultima Markets MT4 Pivot Indicator

Ultima Markets MT4 Pivot Indicator for EUR/USD
  • According to the pivot indicator in Ultima Markets MT4, the central price of the day is established at 1.05797, 
  • Bullish Scenario: Bullish sentiment prevails above 1.05797, first target 1.05933, second target 1.06205; 
  • Bearish Outlook: In a bearish scenario below  1.05797, first target 1.05526, second target 1.05383. 

Conclusion 


Ultima Markets – Trading Session Adjustment for EU&UK Daylight Saving (DST)

The trading sessions for EU&UK Daylight Saving (DST) will be updated from 29 October 2023 as per the following schedule:
Date Product Original Trading Sessions (GMT+3) Updated Trading Sessions (GMT+3)
2023/10/29 (Sun.) UKOUSD Mon 01:00-24:00
Tue-Fri 03:00-24:00
Mon 02:00-24:00
Tue-Fri 00:00-01:00; 03:00-24:00
Ger40 Mon-Thu 03:15-24:00
Fri 03:15-23:00
Mon-Fri 03:15-23:00
Ger40ft Mon-Thu 03:15-24:00
Fri 03:15-23:00
Mon-Fri 03:15-23:00
ES35 Mon-Fri 09:00-21:00 Mon-Fri 10:00-21:00
Cocoa Mon-Fri 11:45-20:30 Mon-Fri 12:45-20:30
Coffee Mon-Fri 11:15-20:30 Mon-Fri 12:15-20:30
Sugar Mon-Fri 10:30-20:00 Mon-Fri 11:30-20:00
FGBL Mon-Fri 03:15-23:00 Mon-Fri 03:15-24:00
FGBM Mon-Fri 03:15-23:00 Mon-Fri 03:15-24:00
FGBX Mon-Fri 03:15-23:00 Mon-Fri 03:15-24:00
FGBS Mon-Fri 03:15-23:00 Mon-Fri 03:15-24:00
FLG Mon-Fri 10:00-20:00 Mon-Fri 11:00-21:00
FEI Mon-Fri 03:00-23:00 Mon-Fri 04:00-24:00

Friendly Reminder

  • • The mentioned times are based on DST system time GMT+3.
  • • Liquidity providers might adjust the trading sessions base on market conditions. The up-to-date execution data should be subject to information on MT4.
    If you have any questions or require assistance, please do not hesitate to contact [email protected]
.holiday_date td{padding: 39px 10px 33px;}

Ultima Markets Index Dividend Adjustment Notice

When you are trading in Contracts for Difference (CFDs) on spot stock indices, if a component of the underlying stock index pays a dividend/dividend (payout) to its shareholders, your trading account will be adjusted ex-dividend at 00:00 server time on the same day, and the corresponding gain or expense will occur depending on the position you are holding and will be reflected in the account history.

• The above data are expressed in the base currency of each index.

• According to market practice, the actual execution data may change, please refer to MT4 software for details.

When the stock index goes ex-dividend, the dividend will be adjusted in the form of fund deduction.

You can view the fund deduction record with the following annotation “Div & stock index name & net lot” in the account history,It is the dividend adjustment. The long lot is calculated as a “positive value”, and the short lot is calculated as a “negative value”. The sum of the two is the “net lot”.

An example is as follows.

If you trade more than 5 lots of DJ30, you can view the “Div & DJ30 & 5” dividend adjustment record in the form of balance in the account history; View the “Div & DJ30 & -5” dividend adjustment records in the form of balance.

We recommend that you carefully evaluate your current positions and consider whether to hold it overnight.

If you have any questions or require assistance, please do not hesitate to contact [email protected]

Germany’s Manufacturing Rebounds: A Comprehensive Analysis


Better-than-expected Manufacturing PMI Recorded for Germany

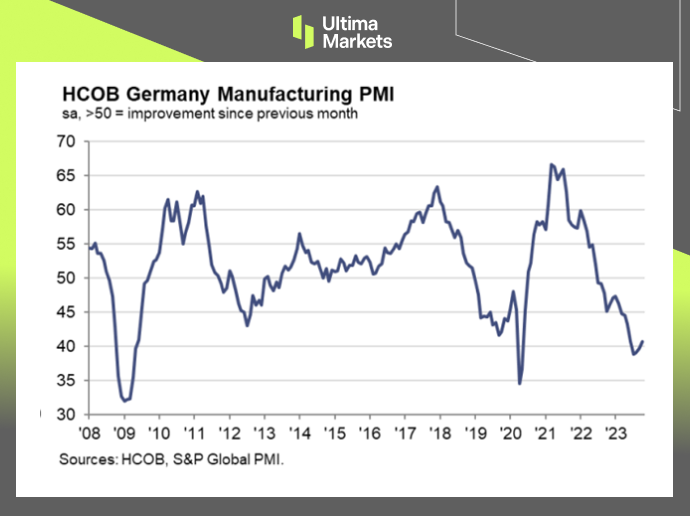
In October 2023, Germany’s manufacturing sector delivered a surprising uptick in performance, marked by the HCOB Flash Germany Manufacturing PMI reaching a 5-month high of 40.7.

This exceeded both expectations and the previous month’s record of 39.6, suggesting a promising turn of events in the German industrial landscape.

While this positive development is noteworthy, it’s essential to understand the broader context of the economic environment and the challenges faced by businesses and labor conditions.


A Ray of Hope in Germany’s Manufacturing

The HCOB Flash Germany’s Manufacturing PMI remarkable rise to 40.7 in October 2023 is a cause for optimism. It’s a significant leap, surpassing the September record and defying expectations. This surge, however, comes with nuances worth exploring.

While the Germany’s manufacturing sector showcased resilience, new orders suffered substantial losses. The decline is evident, reaching its lowest level since June. Additionally, the rate at which companies downsized their workforce in October was the fastest since October 2020.

The pricing front painted a mixed picture: factory gate charges continued their fifth consecutive month of decline, albeit at a slower rate, while manufacturers faced considerable drops in the costs of purchasing materials. Importantly, manufacturers retained a sense of pessimism regarding the future.

These statistics suggest that while manufacturing improved, challenges still persist. The manufacturing sector’s resilience in the face of adversity is a testament to its robust nature, but the decline in new orders and the workforce reduction rate warrant close monitoring.

(HCOB Flash Germany's Manufacturing PMI,S&P Global) 

(HCOB Flash Germany Manufacturing PMI,S&P Global) 


German Composite PMI Displaying Lukewarm Business Activities  

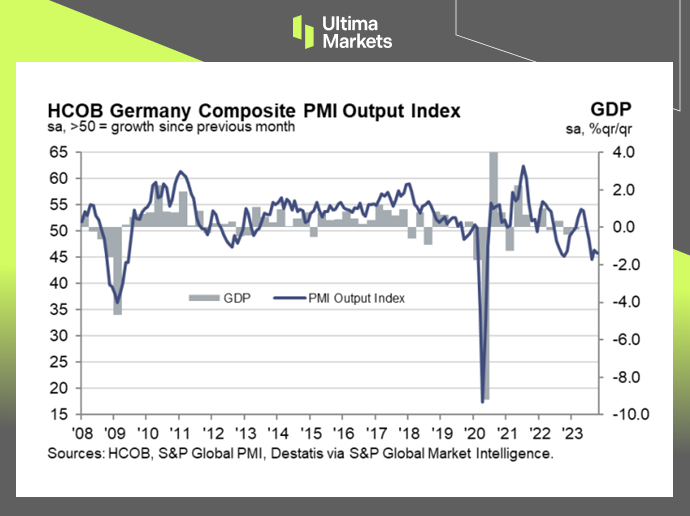
In October 2023, the HCOB Germany’s Composite PMI painted a different picture, falling to 45.8, below the previous month’s 46.4 and market expectations of 46.7. This decline points to an overall contraction in economic activity.

Both the service sector, which showed slight improvement the previous month, and Germany’s manufacturing output continued to decrease. Furthermore, the inflow of new business saw its sharpest decline since May 2020, and backlogs of work dwindled.

One significant concern is the rise in unemployment, compared to September, when workforce numbers had declined for the first time in nearly 3 years. On the pricing front, the rate of inflation for output charges remained relatively stable in October, following a low point in September. Regrettably, businesses maintained a low level of confidence in the outlook for the year ahead.

These trends in the Composite PMI are cause for concern. The decline in overall economic activity, the contraction of the service sector, and persistent unemployment challenges paint a less optimistic picture. It’s imperative to closely monitor these trends to gauge the trajectory of Germany’s economy.

(HCOB Flash Germany Composite PMI Output Index,S&P Global) 

(HCOB Flash Germany Composite PMI Output Index, S&P Global) 


Conclusion

In conclusion, Germany’s manufacturing sector’s unexpected rebound in October 2023 is a welcome development, demonstrating its resilience in the face of adversity.

However, the decline in new orders, the rapid workforce reduction rate, and ongoing pessimism regarding the future highlight the challenges that persist.

Meanwhile, the Composite PMI figures indicate a broader economic slowdown, with the service sector contracting, unemployment rising, and businesses maintaining a cautious outlook.

As businesses and policymakers navigate these uncertain times, understanding the intricate dynamics of Germany’s economic landscape becomes increasingly crucial. While there are bright spots, acknowledging the challenges and seeking solutions is essential to ensuring a stable and thriving economic future for the country.