Important Information

You are visiting the website that is operated by Ultima Markets Ltd, a licensed investment firm by the Financial Services Commission “FSC” of Mauritius, under license number GB 23201593. Please be advised that Ultima Markets Ltd does not have legal entities in the European Union.

If you wish to open an account in an EU investment firm and protected by EU laws, you will be redirected to Ultima Markets Cyprus Ltd (the “CIF”), a Cyprus investment firm duly licensed and regulated by the Cyprus Securities and Exchange Commission with license number 426/23.

Korean Won Revived After Interventions by Korean Government

Understanding the South Korean Currency Dynamics and Market Interventions

In the global financial landscape, the South Korean Won (KRW) has showcased a narrative of resilience and volatility in recent months, reflecting the intricate interplay of global economic forces and local regulatory interventions.

Let’s delve into the multifaceted factors contributing to the EBB and flow of the Won against the US dollar, examining how interventions and market movements have sculpted its trajectory.


Korean Won Revived in November

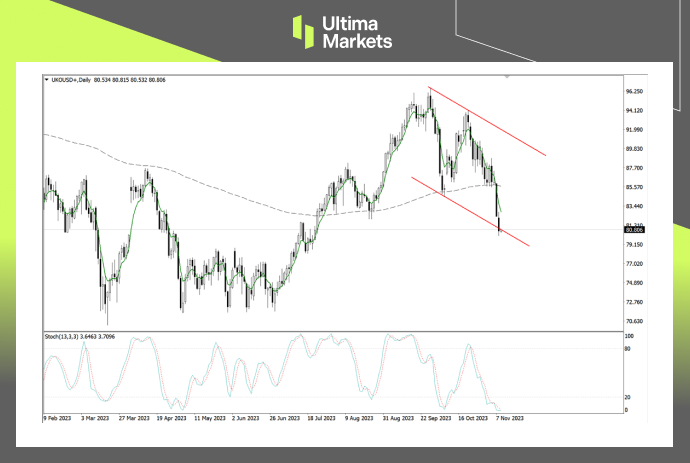
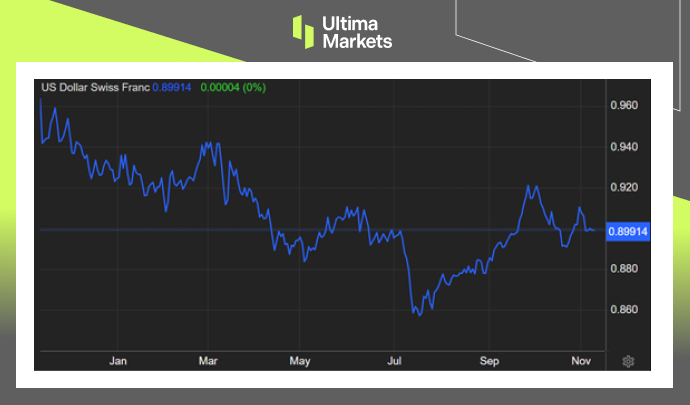
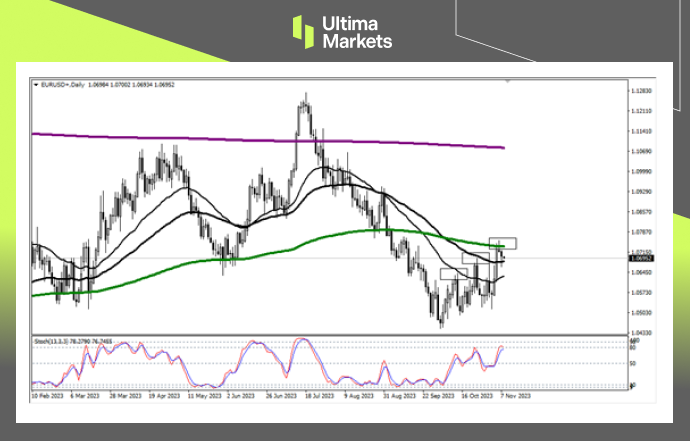
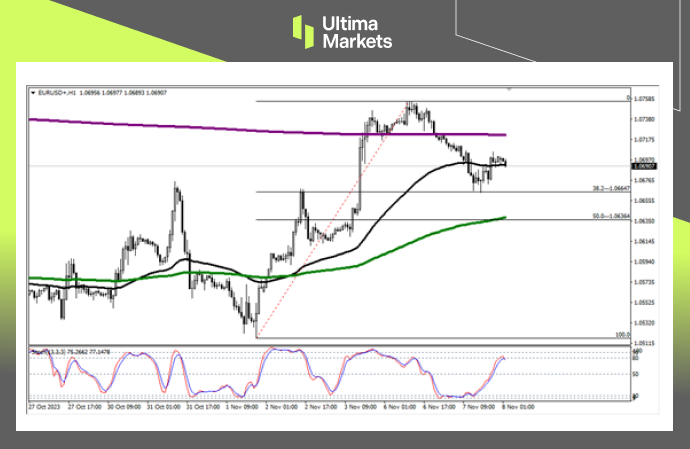
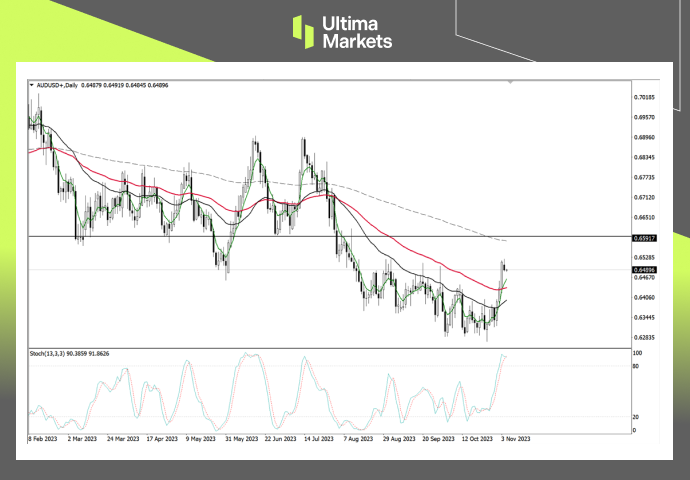
November witnessed a striking revival for the South Korean Won, marking a surge to approximately 1310 per USD, bouncing back from an 11-month low of 1356 in the previous month.

This resurgence owes itself to several factors, notably the perceptible weakening of the US dollar and a notable shift in the Federal Reserve’s stance towards a more dovish monetary policy. The termination of the rate-hike campaign from the Fed notably bolstered the Won’s value.

USD/KRW One-year Chart From Ultima Markets MT4

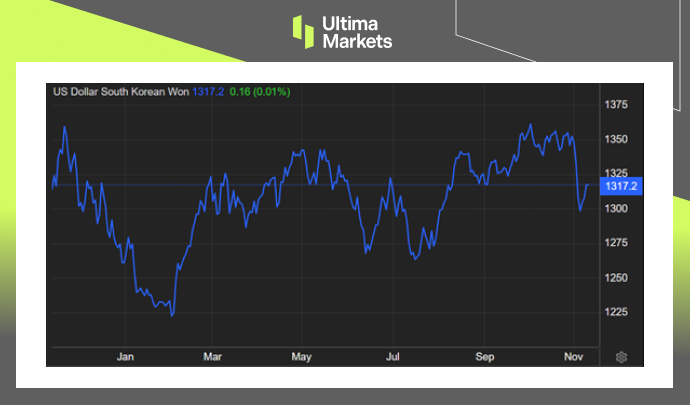
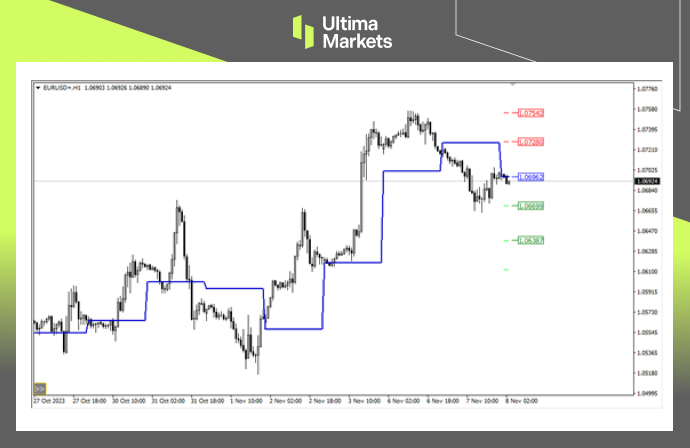
(USD/KRW One-year Chart) 


Market Influence and Regulatory Actions

The Won’s resurgence was complemented by heightened foreign investment in the stock market, further underpinned by the decision of authorities to extend the ban on short selling until at least June of the following year.

However, despite these positive market movements, the year saw the Korean currency witnessing a 4% fall against the US dollar. This depreciation was propelled by multifaceted elements, including geopolitical risks, flight to safety, and a widening interest rate gap between South Korea and the US.


Market Intervention and the Central Bank’s Role

The Bank of Korea (BOK) played a pivotal role in curbing the Won’s depreciation, intervening in the forex market consistently throughout the year.

This proactive intervention led to a decline in foreign exchange reserves, which hit $412.87 billion in October, representing the lowest figures since June 2020.


Navigating Forex Reserves and Market Stability

South Korea’s foreign reserves faced a continuous decline, attributed to their utilization in stabilizing the foreign exchange market, a move sanctioned by the Bank of Korea.

By October’s closure, these reserves had diminished to $412.87 billion, showing a decrease of $1.24 billion from the prior month.

The breakdown of these reserves into various components like securities, deposits, special drawing rights, gold bullion, and IMF positions reflects a diverse strategy in safeguarding market stability.


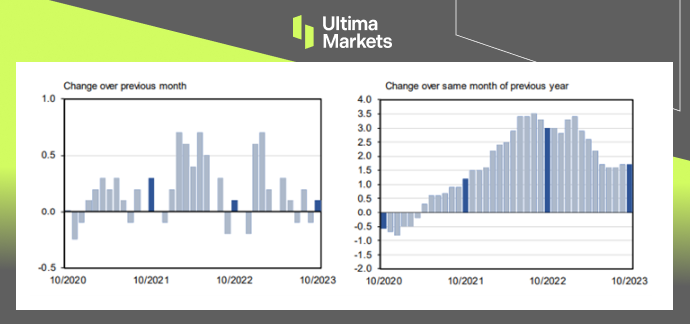
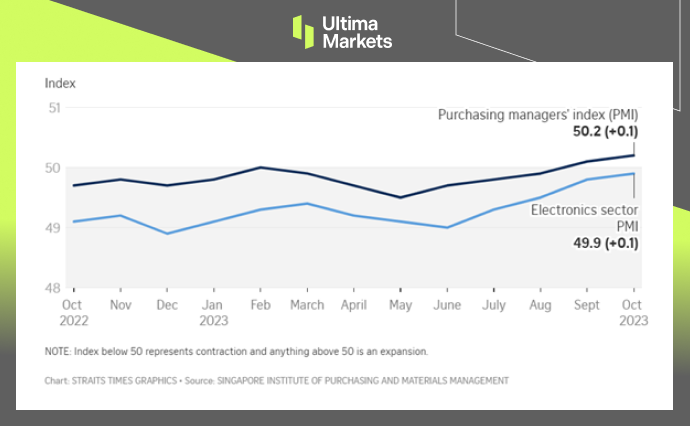
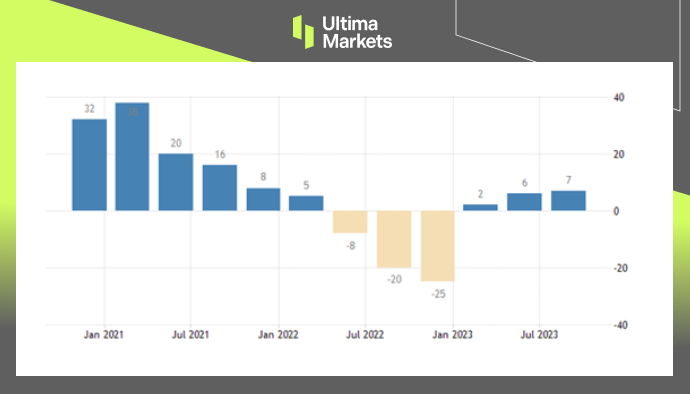
Foreign Exchange Reserves Lowest in Over Three Years 

South Korea’s foreign reserves fell for the third consecutive month as they were used to stabilize the foreign exchange market, according to the Bank of Korea (BOK). By the end of October, foreign currency reserves were $412.87 billion, down $1.24 billion from the previous month.

The reserves included $369.98 billion in securities, $18.87 billion in deposits, $14.77 billion in special drawing rights, $4.79 billion in gold bullion, and $4.45 billion in the IMF position.

South Korea remained the world’s ninth-largest holder of foreign reserves as of the end of September. Despite the declining trend, the central bank is not worried.

The BOK Governor Rhee Chang-yong said in late October that reserves have been stable since 2021 and increasing them further would come at a cost.  

Foreign Exchange Reserves, Bank of Korea in a Bar Chart

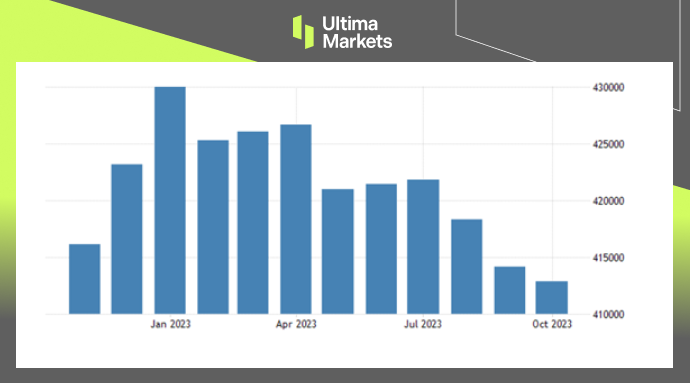
(Foreign Exchange Reserves, Bank of Korea) 


Bottom Line

The South Korean currency’s trajectory reflects a dynamic interplay of global economic forces, market sentiments, and regulatory interventions.

As the authorities balance stability and growth, the resilience and adaptability of the Won against external pressures become increasingly evident.

Understanding this complex landscape is pivotal for stakeholders navigating the South Korean financial markets, highlighting the intricate balance between interventions and market dynamics.


Ultima Markets Notification of Server Upgrade

As part of our commitment to providing our clients with the best reliability and service, there will be a server upgrade & maintenance this weekend. Trading sessions this weekend are as follows:

Date

Trading sessions (GMT+2)

Trade status

Maintenance sessions (GMT+2)

2023/11/11 (Sat.)

08:00-23:59

08:00 Late Open

00:00-08:00

2023/11/12 (Sun.)

00:00-23:59

Normal

Friendly Reminder

• During the upgrade process, the client portal and UM App will be temporarily unavailable. Our official website will remain available, but clients will not be able to sign up.

• During the upgrade process, the features of MetaTrader software & application, including but not limited to logging in, quoting and opening/closing positions, will be temporarily unavailable.

• There might be a gap between the original price and the price after maintenance. The gap between Pending Orders, Stop Loss and Take Profit will be filled at the market price once the maintenance is completed.

• Please refer to MT4 for the latest update on the completion and market opening time.

If you have any questions or require assistance, please do not hesitate to contact [email protected].

Focus on BRENT OIL Today – 9th November 2023


Comprehensive Brent Oil for November 9, 2023

In this comprehensive analysis, Ultima Markets brings you an insightful breakdown of the BRENT OIL for 9th November 2023. 


Key Takeaways 

  • Global economic downturn: The overseas economic recovery is less than expected. For example, the U.S. unemployment rate has exceeded expectations in the past two months, and the new orders index has accelerated its contraction. This has led to doubts about the future demand for crude oil, and oil prices have followed the trend to chart the gains driven by early risk aversion. 
  • The balance between S/D supports oil prices: The overall supply side of crude oil has not yet shown signs of tightening. In the long term, the supply and demand pattern is relatively loose, but in the short term there may be production cuts on the supply side, and there may be some support for prices. 

Brent Oil Technical Analysis

Brent Oil Daily Chart Insights

Brent Oil Daily Chart Insights by Ultima Markets MT4
  • Stochastic Oscillator: The indicator has entered the oversold range, and the selling pressure is serious. You need to be alert to the coming of a short-term intraday rebound in the market. 
  • Moving average: After the 5-day moving average completely fell below the 200-day moving average, the market did not show an effective rebound structure, and the two consecutive days of decline may take some time to correct. The rebound target price is looking towards the 5-day moving average. 
  • Downward channel line: Since crude oil began to fall on September 27, the overall market trend has formed a downward channel line. Yesterday’s decline touched the lower edge of the channel line, and there is a certain probability of a rebound in the short term. 

Brent Oil 1-hour Chart Analysis

Brent Oil 1-hour Chart Analysis By Ultima Markets MT4
  • Stochastic oscillator: The indicator has sent a long signal, and oil prices have a certain rebound momentum. However, oil prices cannot rebound lightly until they break through the 81.316 level. 
  • Price Action: Oil prices are currently in a strong downward trend, and you cannot arbitrarily choose to enter the market at the bottom. Although the current indicators are suggesting that a rebound is imminent, we need to wait for a clear bullish structure before making a correction. 

Ultima Markets MT4 Pivot Indicator

Ultima Markets MT4 Pivot Indicator for Brent Oil
  • According to the pivot indicator in Ultima Markets MT4, the central price of the day is established at 81.178, 
  • Bullish Scenario: Bullish sentiment prevails above 81.178, first target 82.268, second target 83.852; 
  • Bearish Outlook: In a bearish scenario below 81.178, first target 79.594, second target 78.519. 

Bottom Line

Ultima Markets Index Dividend Adjustment Notice

When you are trading in Contracts for Difference (CFDs) on spot stock indices, if a component of the underlying stock index pays a dividend/dividend (payout) to its shareholders, your trading account will be adjusted ex-dividend at 00:00 server time on the same day, and the corresponding gain or expense will occur depending on the position you are holding and will be reflected in the account history.

• The above data are expressed in the base currency of each index.

• According to market practice, the actual execution data may change, please refer to MT4 software for details.

When the stock index goes ex-dividend, the dividend will be adjusted in the form of fund deduction.

You can view the fund deduction record with the following annotation “Div & stock index name & net lot” in the account history,It is the dividend adjustment. The long lot is calculated as a “positive value”, and the short lot is calculated as a “negative value”. The sum of the two is the “net lot”.

An example is as follows.

If you trade more than 5 lots of DJ30, you can view the “Div & DJ30 & 5” dividend adjustment record in the form of balance in the account history; View the “Div & DJ30 & -5” dividend adjustment records in the form of balance.

We recommend that you carefully evaluate your current positions and consider whether to hold it overnight.

If you have any questions or require assistance, please do not hesitate to contact [email protected]

Switzerland Tops Euro Nations With Remarkable Inflation Rate


Inflation Rate Remains Unchanged at 1.7%

Switzerland stands out as a beacon of stability and resilience.

In October 2023, the annual inflation rate in Switzerland remained steady at 1.7%, meeting market predictions. There was a 0.1% increase in the Consumer Price Index (CPI) compared to the previous month, reversing a 0.1% decline.

Several factors contributed to the 0.1% month-on-month increase, including higher heating oil and air transport prices. Women’s coats and jackets, as well as foreign red wine, also experienced price hikes. On the other hand, prices for hotels, petrol, and fruiting vegetables declined. 


Factors Driving Inflation

1. Energy Sector Impact

The month-on-month increase is partly attributed to higher heating oil and air transport prices. Switzerland’s strategic measures to navigate the challenges posed by escalating energy costs have not only maintained stability but have also propelled the nation forward.

2. Commodities Market Influence

Specifically noteworthy are the price hikes in women’s coats and jackets, alongside foreign red wine. These seemingly disparate sectors contribute to the intricate dance of the Swiss economy, showcasing adaptability in the face of diverse market forces.

3. Countering Declines

Conversely, certain sectors experienced price declines. Notably, hotels, petrol, and fruiting vegetables saw reduced prices. This balanced approach to inflationary pressures exemplifies Switzerland’s commitment to equilibrium in the marketplace.


Harmonised Index of Consumer Prices (HICP)

The Harmonized Index of Consumer Prices (HICP) allows for inflation comparison between Switzerland and other European Union member countries, as it uses a standardized methodology across the EU.

The cost of living in Switzerland, as measured by the HICP, went up 0.1% for the third month running, indicating that inflation continued its gradual increase despite relatively low overall inflation numbers. On a year-over-year basis, it went up by 2.0%.

Swiss Consumer Price Index, Federal Statistical Office FSO Bar Chart

(Swiss Consumer Price Index, Federal Statistical Office FSO) 

International Benchmarking

Switzerland, often overshadowed by its European counterparts, emerges as a beacon of fiscal prudence. Continuously surpassing both Germany and the European Monetary Union in inflation performance, Switzerland’s economic strategy underscores a commitment to outpacing global standards.


Swiss Franc Rebounds from One-month Low 

Beyond inflation, the resurgence of the Swiss franc demands attention.

Rebounding from a one-month low, the franc strengthened beyond 0.9 per USD, marking a significant recovery from the four-week low at 0.91 on October 31.

This resurgence can be attributed to the proactive intervention of the Swiss National Bank (SNB)

USD/CHF 1-year Chart By Ultima Markets MT4

(USD/CHF 1-year Chart) 

SNB’s Strategic Intervention

The SNB’s substantial sale of foreign exchange reserves underscores a proactive approach to support the franc. This intervention, aimed at mitigating the impact of import inflation resulting from higher energy prices, showcases the SNB’s commitment to maintaining economic stability.

Foreign Exchange Dynamics

Remarkably, data from the SNB reveals that its foreign exchange reserves reached their lowest level in over five years in September. This deliberate reduction aligns with Switzerland’s strategic vision, prioritizing currency strength and resilience in the face of global economic challenges.


Bottom Line

In conclusion, Switzerland’s economic landscape stands as a testament to resilience, strategic planning, and fiscal prudence.

The nation’s ability to navigate inflationary pressures while concurrently bolstering its currency is a model for others to emulate.

As we delve into the intricacies of Switzerland’s economic narrative, it becomes evident that the nation’s commitment to stability positions it as a formidable force in the global economic arena.


Ultima Markets – The Rollover Schedule of Futures in Nov

Futures contracts switch to new contracts on the expiration date regularly, the process is known as “Rollover.” Market prices may experience fluctuations caused by non-market factors after the rollover. Positions in futures contracts will undergo corresponding funding adjustments based on the rollover direction to reflect the value change when transitioning between old and new contracts. Below is the schedule for the futures contract rollover at Ultima Markets in November.

The Rollover Schedule of Futures in Nov

Symbol

Description

Rollover Date

Current Contract

Next Contract

VIX

Volatility

2023/11/10

Nov-2023

Dec-2023

FRA40ft

France 40 Index Future

2023/11/15

Nov-2023

Dec-2023

CL-OIL

Crude Oil West Texas Future

2023/11/16

Dec-2023

Jan-2024

UKOUSDft

Brent Oil Future

2023/11/22

Dec-2023

Jan-2024

FLG

UK Long Gilt Futures

2023/11/23

Dec-2023

Mar-2024

CHINA50ft

CHINA50 Future

2023/11/24

Nov-2023

Dec-2023

HK50ft

Hong Kong 50 Future

2023/11/28

Nov-2023

Dec-2023

TY

US 10 YR T-Note Futures Decimalised

2023/11/28

Dec-2023

Mar-2024

FGBX

Euro – BUXL Futures

2023/12/01

Dec-2023

Mar-2024

FGBS

Euro – Schatz Futures

2023/12/01

Dec-2023

Mar-2024

FGBL

Euro – Bund Futures

2023/12/05

Dec-2023

Mar-2024

FGBM

Euro – BOBL Futures

2023/12/05

Dec-2023

Mar-2024

Friendly Reminder

• Internal transfers will be suspended during the half-hour before and after the rollover.

• Investors are advised to carefully manage their positions or adjust the take-profit and stop-loss settings before the rollover.

• Liquidity providers might adjust the rollover schedules base on the dynamic nature of market conditions. The up-to-date execution data should be subject to information on the MetaTrader software/application.

If you have any questions or require assistance, please do not hesitate to contact [email protected].

Ultima Markets Index Dividend Adjustment Notice

When you are trading in Contracts for Difference (CFDs) on spot stock indices, if a component of the underlying stock index pays a dividend/dividend (payout) to its shareholders, your trading account will be adjusted ex-dividend at 00:00 server time on the same day, and the corresponding gain or expense will occur depending on the position you are holding and will be reflected in the account history.

• The above data are expressed in the base currency of each index.

• According to market practice, the actual execution data may change, please refer to MT4 software for details.

When the stock index goes ex-dividend, the dividend will be adjusted in the form of fund deduction.

You can view the fund deduction record with the following annotation “Div & stock index name & net lot” in the account history,It is the dividend adjustment. The long lot is calculated as a “positive value”, and the short lot is calculated as a “negative value”. The sum of the two is the “net lot”.

An example is as follows.

If you trade more than 5 lots of DJ30, you can view the “Div & DJ30 & 5” dividend adjustment record in the form of balance in the account history; View the “Div & DJ30 & -5” dividend adjustment records in the form of balance.

We recommend that you carefully evaluate your current positions and consider whether to hold it overnight.

If you have any questions or require assistance, please do not hesitate to contact [email protected]

Focus on EUR/USD Today – 8th November 2023 


Comprehensive EUR/USD for November 8, 2023

In this comprehensive analysis, Ultima Markets brings you an insightful breakdown of the EUR/USD for 8th November 2023. 


Key Takeaways

  • Hawkish statement from Fed member: Federal Reserve member Kashkari said that given the recent series of strong economic data, the Fed may have to take more measures to reduce inflation to the 2% target level. At the same time, regarding the issue of interest rate cuts, he said that the FOMC did not discuss the content of interest rate cuts. 
  • Powell will address a speech: Federal Reserve Chairman Powell will speak at the event tonight, and the market is paying attention to whether the chairman will release more forward guidance. 

EUR/USD Technical Analysis 


EUR/USD Daily Chart Insights

EUR/USD Daily Chart Insights by Ultima Markets MT4
  • Stochastic Oscillator: After the indicator hovered at the 50 mid-line for a period of time, it issued a bull signal again. However, judging from the market situation, the current bullish trend is still not clear and needs to wait for important resistance levels to be broken before it can be confirmed.
  • Moving average: The recent rise has hit the moving average resistance, then broke through the moving average after a correction, and then encountered resistance to the moving average again. Yesterday, the market touched the key 240-day moving average (green). Pay attention to whether the market will completely open up the upper space after the correction.  

EUR/USD 1-hour Chart Analysis

EUR/USD 1-hour Chart Analysis by Ultima Markets MT4
  • Stochastic oscillator: After the indicator forms a long signal, the market does not rise rapidly. The price may still oscillate, and the indicator may send a long signal again before looking for trading opportunities. 
  • Moving average: The current 65-period moving average is the key support and resistance conversion level during the day. If the price rebounds and breaks through 1.07047, the exchange rate will look towards the purple 2400-period moving average. On the contrary, if it falls below the black 65-period moving average, the euro will still depreciate in the short term. 
  • Fibonacci retracement level: The market is blocked at the 38.2% retracement level. If it continues to fall below, focus on the 50% retracement level. This price is also the overlap position of the green 240-period moving average. 

Ultima Markets MT4 Pivot Indicator

Ultima Markets MT4 Pivot Indicator for EUR/USD
  • According to the pivot indicator in Ultima Markets MT4, the central price of the day is established at 1.06962, 
  • Bullish Scenario: Bullish sentiment prevails above 1.06962, first target 1.07280, second target 1.07542; 
  • Bearish Outlook: In a bearish scenario below 1.06962, first target 1.06699, second target 1.06387. 

Conclusion

Singapore’s PMI Moderate Growth, Index Hits 1.2-Year High


Singapore’s Manufacturing Sector: A Resilient Recovery and Soaring Confidence

In the ever-evolving landscape of Singapore’s manufacturing sector, the latest data paints a promising picture of recovery and growth.

The Purchasing Managers’ Index (PMI) for October 2023 inched up slightly to 50.2, marking the second consecutive month above the pivotal 50-point threshold.

This upward trend signals a robust recovery and an expansion of factory activity, underlining the resilience of Singapore’s manufacturing landscape.


Steady Gains in Key Metrics

Crucial metrics such as factory output, new exports, and employment have witnessed positive developments, indicating a steady climb back to pre-contraction levels. This optimistic trend is particularly encouraging given the recent six-month contraction period.

Despite the challenges posed by sluggish external demand, the manufacturing sector is demonstrating its ability to adapt and thrive.

Simultaneously, the electronics sector, which accounts for approximately 40% of Singapore’s industrial output, saw its activity decline for the 15th consecutive month in October. However, the rate of decline moderated slightly, with a reading of 49.9 compared to 49.8 in September.  

Singapore Manufacturing PMI, SIPMM Graph

(Singapore Manufacturing PMI, SIPMM)

Factory Output Takes Center Stage

Factory output, a cornerstone of manufacturing vitality, has shown notable improvement. The positive momentum suggests increased production activities, reflecting not only a recovery but also a potential uptick in consumer demand.

This bodes well for the overall economic landscape, as manufacturing often serves as a barometer for broader economic health.

New Exports Signal Global Relevance

The uptick in new exports is another noteworthy aspect of Singapore’s manufacturing resurgence. Despite external challenges, the sector is positioning itself on the global stage, showcasing its resilience and adaptability.

This is a testament to the competitiveness of Singaporean products in the international market.

Employment on the Rise

A positive correlation between increased factory activity and employment growth is a pivotal marker of a thriving manufacturing sector. As the manufacturing landscape expands, job opportunities follow suit, contributing to the overall economic well-being of the nation.


Navigating Challenges: A Balanced Outlook

While the overall trajectory is positive, it’s crucial to acknowledge and address the challenges that persist. Despite improvements, input purchases and new orders continue to contract, influenced in part by the economic deceleration in China and geopolitical tensions.

Additionally, supplier deliveries have experienced deterioration, reflecting the interconnected nature of global supply chains.

Electronics Sector: A Mixed Bag

The electronics sector, a significant contributor to Singapore’s industrial output, witnessed a decline for the 15th consecutive month in October. However, the rate of decline moderated slightly, signaling potential stabilization. This nuanced perspective underscores the sector’s resilience amid external pressures.


Business Confidence: Reaching New Heights

Beyond the numbers, the third quarter of 2023 brought a surge in business confidence, reaching its highest level in 18 months. This surge, from a confidence index of 6 to 7, signifies a renewed optimism within the manufacturing community.

Business Confidence, Singapore Department of Statistics Bar Chart

(Business Confidence, Singapore Department of Statistics) 

Electronics Industry: A Driving Force

The electronics industry, particularly the semiconductor segment, emerged as a major driver of this newfound confidence. The confidence index soared from 11 in the second quarter to an impressive 23 in the third quarter.

This surge underscores the pivotal role of semiconductors in shaping the outlook of the manufacturing sector.

General Manufacturing: Diverse Optimism

Diversification of optimism is evident in the general manufacturing sector, where an overall increase from -8 to 6 is observed. This shift is primarily attributed to positive sentiments surrounding food, beverages, and tobacco manufacturing.

The sector’s ability to adapt and pivot towards areas of demand is a testament to its resilience.


Sector-Specific Variances: A Nuanced Landscape

While overall confidence rose, specific sectors experienced divergent trends. The transport engineering sector witnessed a dip from 43 to 35, signaling a need for strategic adjustments.

Similarly, assessments for the chemicals, biomedical manufacturing, and precision engineering segments saw fluctuations, highlighting the importance of targeted strategies for sustained growth.

In conclusion, Singapore’s manufacturing sector is on a trajectory of resilience and recovery. The positive indicators across key metrics and the surge in business confidence underscore the adaptability and strength of the sector.

As challenges persist, addressing them with strategic precision will be paramount in ensuring a sustained and robust manufacturing landscape for Singapore.


Focus on AUD/USD Today – 7th November 2023 


Comprehensive AUD/USD for November 7, 2023

In this comprehensive analysis, Ultima Markets brings you an insightful breakdown of the AUD/USD for 7th November 2023. 


Key Takeaways

  • Changes in the RBA’s monetary policy: The Reserve Bank of Australia will announce its latest interest rate decision at noon. Due to the unexpectedly strong CPI in Australia in the third quarter and the rebound in housing prices to near record highs, the market expects that the possibility of the Reserve Bank of Australia raising interest rates by 25 basis points this week reaches 60% . On the contrary, if there is no sign of tightening in monetary policy, AUD/USD will enter a rapid downward trend. 
  • Bullock has a hawkish attitude: The new chairman of the Reserve Bank of Australia, Bullock, said in a public speech that “if the inflation outlook shows a substantial increase, we will not hesitate to further raise the cash rate.” Expectations that the Reserve Bank of Australia will resume raising interest rates have triggered a strong rise in the Australian dollar recently. 

AUD/USD Technical Analysis 


AUD/USD Daily Chart Insights

AUD/USD Daily Chart Insights by Ultima Markets MT4
  • Stochastic Oscillator: The indicator has entered the overbought area, indicating the strength of the current bullish trend. Although there were signs of a reversal yesterday, we cannot judge that a reversal is coming without confirmation. 
  • Moving average: After the exchange rate strongly breaks through the 33-day moving average and the 65-day moving average, it hints that the current bullish trend is coming, and the resistance level is looking towards the 200-day moving average (dashed line). There is a certain probability of going back to the green 5-day moving average. 

AUD / USD 1-hour Chart Analysis

AUD/ USD 1-hour Chart Analysis by Ultima Markets MT4
  • Stochastic oscillator: The indicator is still in the oversold area. Judging from the market trend, it is currently in the consolidation stage. Wait for the indicator to show a long signal before paying attention to whether there are trading opportunities. 
  • Price Action: After consolidation for two trading days, the market formed a rectangular range. After falling below the range, the exchange rate will most likely continue to decline in the short term. Pay attention to the support price below. 
  • Support price: The red 65-period moving average is the first target support level. If the market enters a deep correction, continue to look at the upper edge of the upward channel line. 

Ultima Markets MT4 Pivot Indicator

Ultima Markets MT4 Pivot Indicator for AUD/USD
  • According to the pivot indicator in Ultima Markets MT4, the central price of the day is established at 0.64993, 
  • Bullish Scenario: Bullish sentiment prevails above 0.64993, first target 0.65131, second target 0.65371; 
  • Bearish Outlook: In a bearish scenario below 0.64993, first target 0.64752, second target 0.64608. 

Conclusion